Benchmarking Results
This page presents VQE benchmarking results from thesis experiments conducted with the Quantum Pipeline. The data covers GPU acceleration performance, iteration counts, and energy results across six molecular systems.
Experimental Setup
Hardware Configurations
Three hardware configurations were used in the thesis experiments:
| Configuration | Processor / GPU | Memory |
|---|---|---|
| CPU Baseline | Intel Core i5-8500 (6 cores @ 3.00 GHz) | 16 GB RAM |
| GPU1 | NVIDIA GTX 1060 (1280 CUDA cores) | 6 GB VRAM |
| GPU2 | NVIDIA GTX 1050 Ti (768 CUDA cores) | 4 GB VRAM |
All configurations operated within a containerized Docker environment using the
nvidia/cuda:11.8.0-cudnn8-devel-ubuntu20.04 base image, ensuring consistency
of the software stack across all experimental runs (docker-compose.thesis.yaml).
Simulation Parameters
The following parameters were held constant across all primary experiments:
| Parameter | Value |
|---|---|
| Basis set | STO-3G |
| Optimizer | L-BFGS-B (gradient-based) |
| Convergence threshold (ftol, gtol) | \(10^{-6}\) |
| Simulation method | Statevector (CPU/GPU) |
| Ansatz | EfficientSU2 |
| Parameter initialization | Random uniform \([0, 2\pi]\) |
The L-BFGS-B
optimizer was selected for its balance between convergence speed and memory
efficiency. It is a limited-memory quasi-Newton method from
scipy.optimize.minimize.
Only this single optimizer was tested in the thesis; other optimizers supported
by the pipeline were not benchmarked.
Evaluation Metrics
The system was assessed on the following metrics:
- Iteration time - wall-clock time for a single VQE optimization iteration
- Total simulation time - elapsed time from initialization to convergence
- Iterations to convergence - number of optimizer iterations required
- Cost function value - final ground-state energy in Hartree (Ha)
- Resource utilization - CPU/GPU load and memory consumption
- Streaming throughput - Apache Kafka and Spark pipeline performance
Molecules Tested
Six molecular systems of increasing complexity were selected to evaluate system performance across a representative range of problem sizes. The molecules span from the simplest two-electron system (H\(_2\)) to twelve-qubit systems (H\(_2\)O, NH\(_3\)).
| Molecule | Formula | Qubits (STO-3G) | Electrons | Approx. Iterations | Complexity |
|---|---|---|---|---|---|
| Hydrogen | H\(_2\) | 4 | 2 | ~650 | Minimal |
| Helium hydride cation | HeH\(^+\) | 4 | 2 | ~630 | Minimal |
| Lithium hydride | LiH | 8 | 4 | ~1,455 | Moderate |
| Beryllium dihydride | BeH\(_2\) | 10 | 6 | ~2,373 | Significant |
| Water | H\(_2\)O | 12 | 10 | ~2,185 | High |
| Ammonia | NH\(_3\) | 12 | 10 | ~2,410 | High |
The progression from 4-qubit to 12-qubit systems allows systematic evaluation of how GPU acceleration scales with problem size and circuit complexity.
Optimization Behavior
Optimization Trajectories
Across all 24 experimental runs (6 CPU, 9 GPU1, 9 GPU2), GPU acceleration did not change optimization trajectories — all hardware configurations produced the same energy results for the same random initialization seed. The optimizer terminated after hundreds to thousands of iterations, but in most cases did not reach the known ground-state energies.
Iteration counts before termination:
- Small molecules (H\(_2\), HeH\(^+\), 4 qubits): ~650 iterations (H\(_2\)) and ~630 iterations (HeH\(^+\)).
- Medium molecules (LiH, 8 qubits): ~1,455 iterations on average.
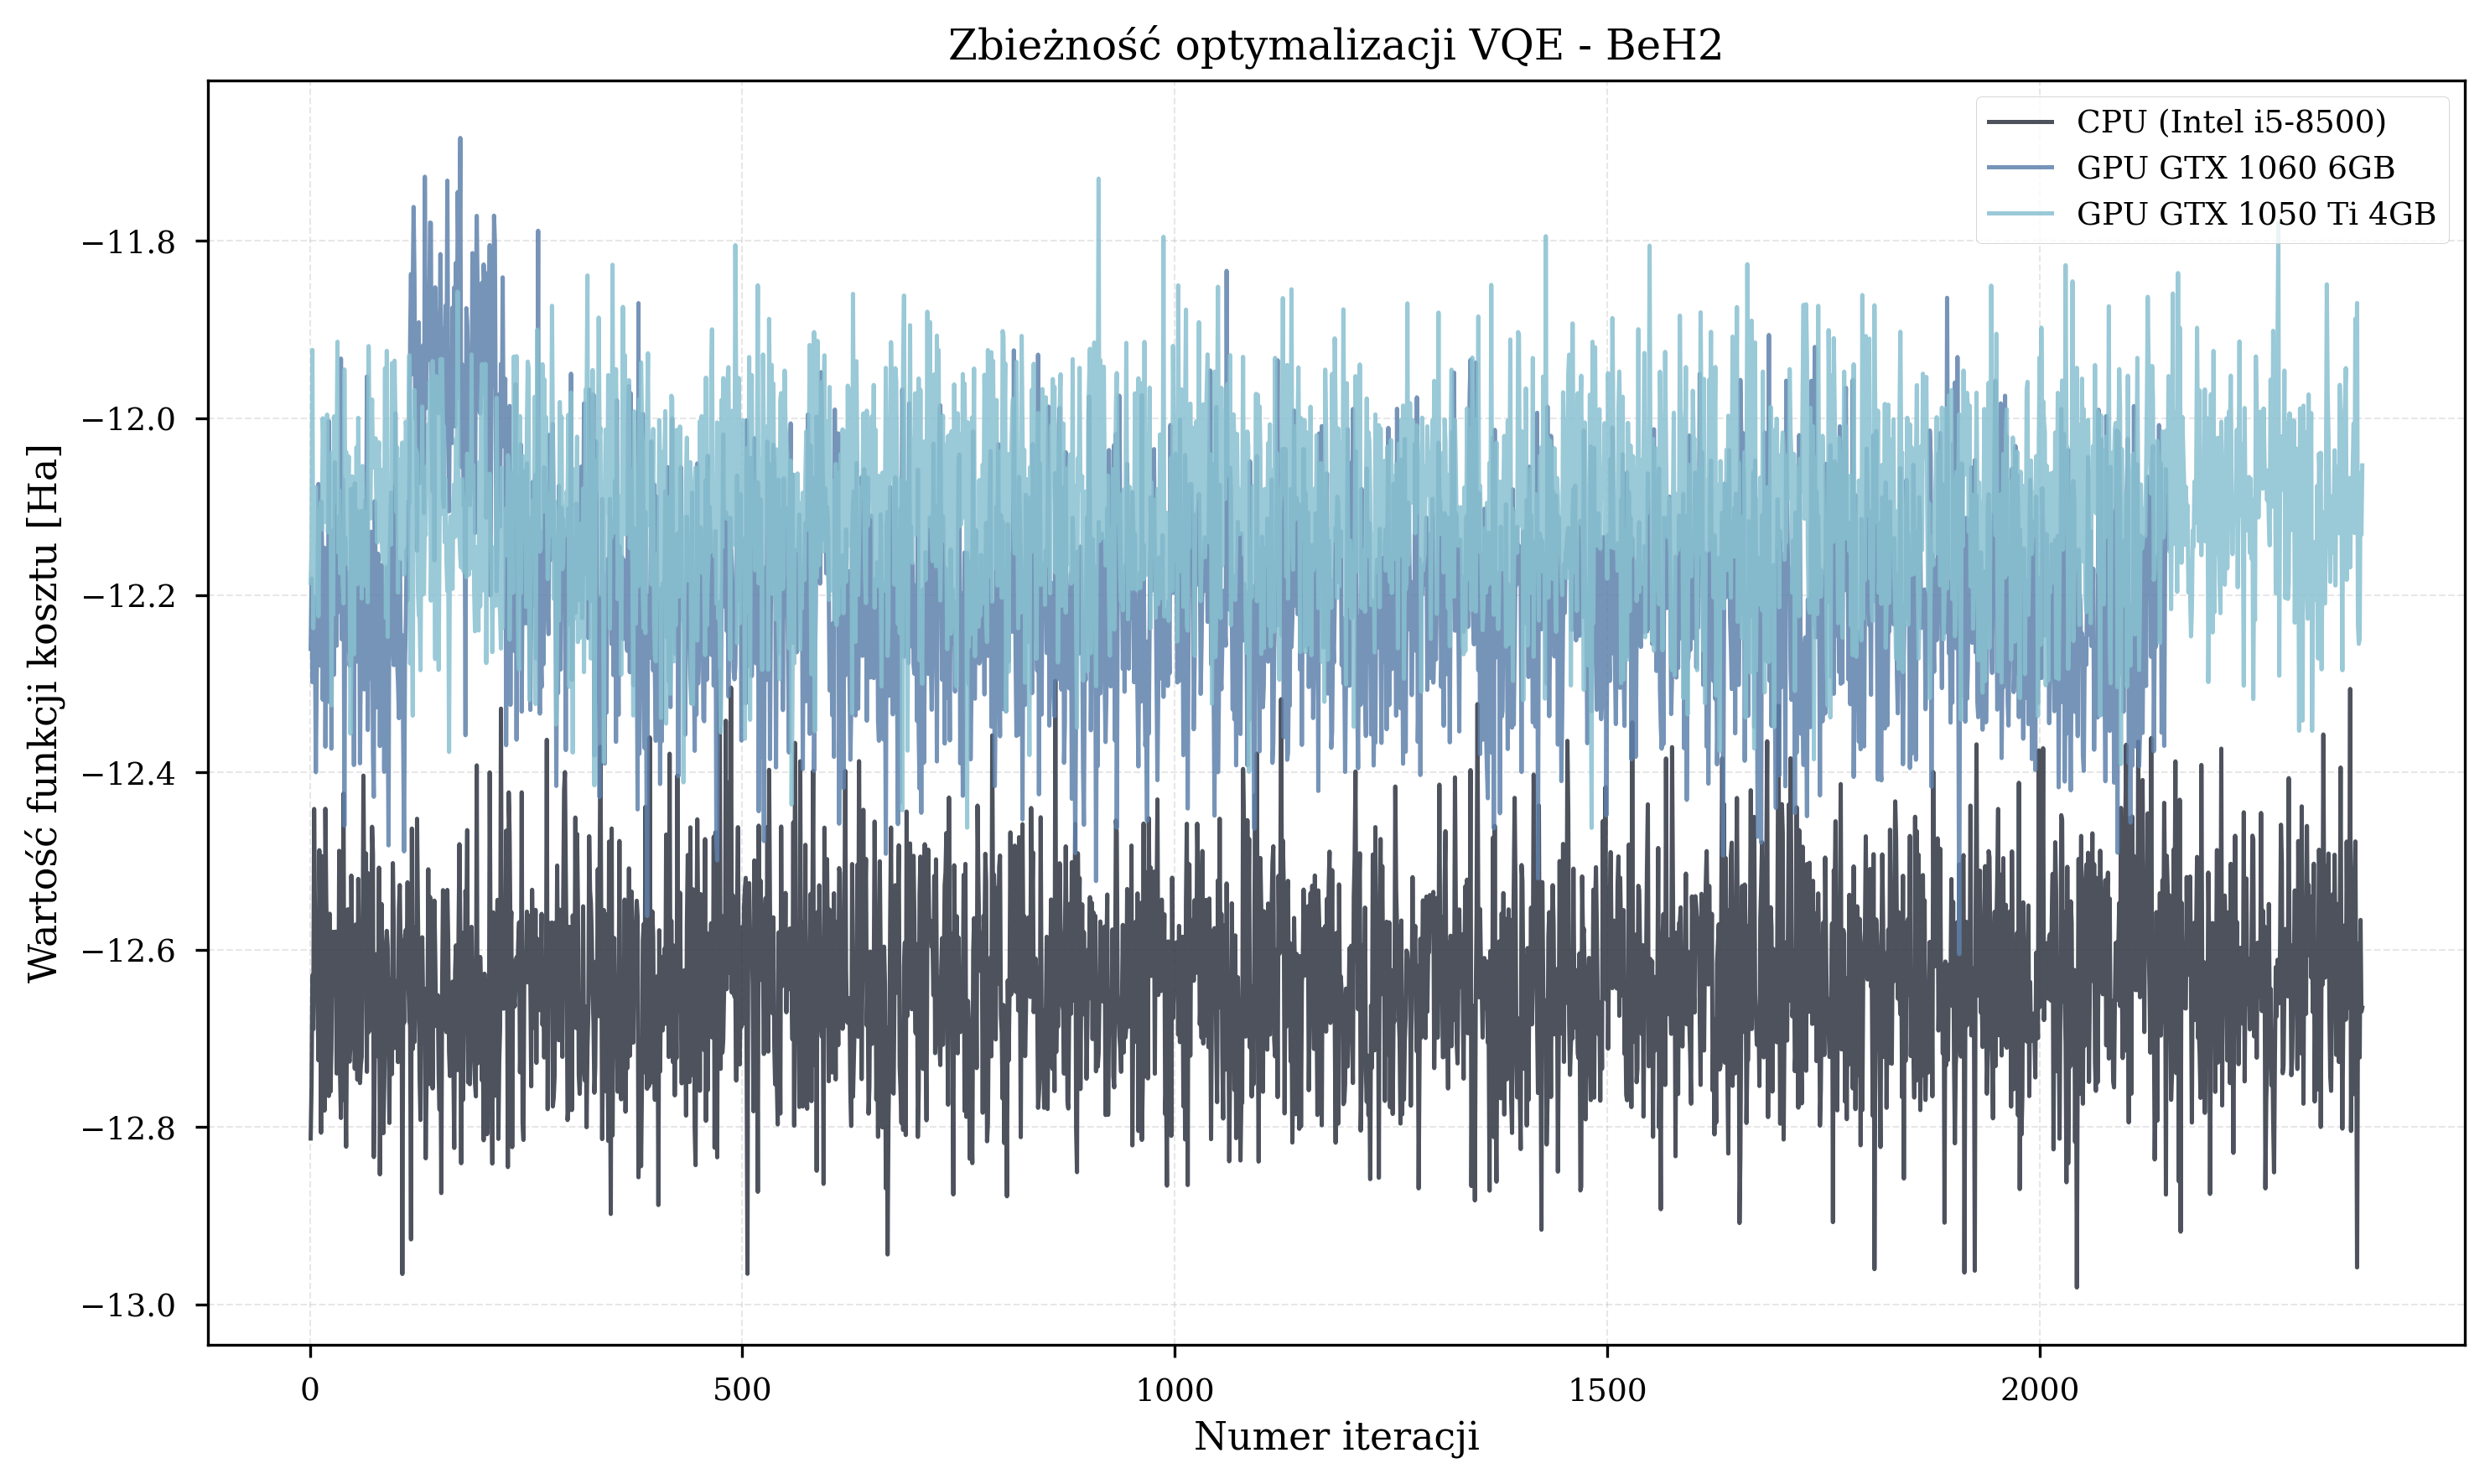
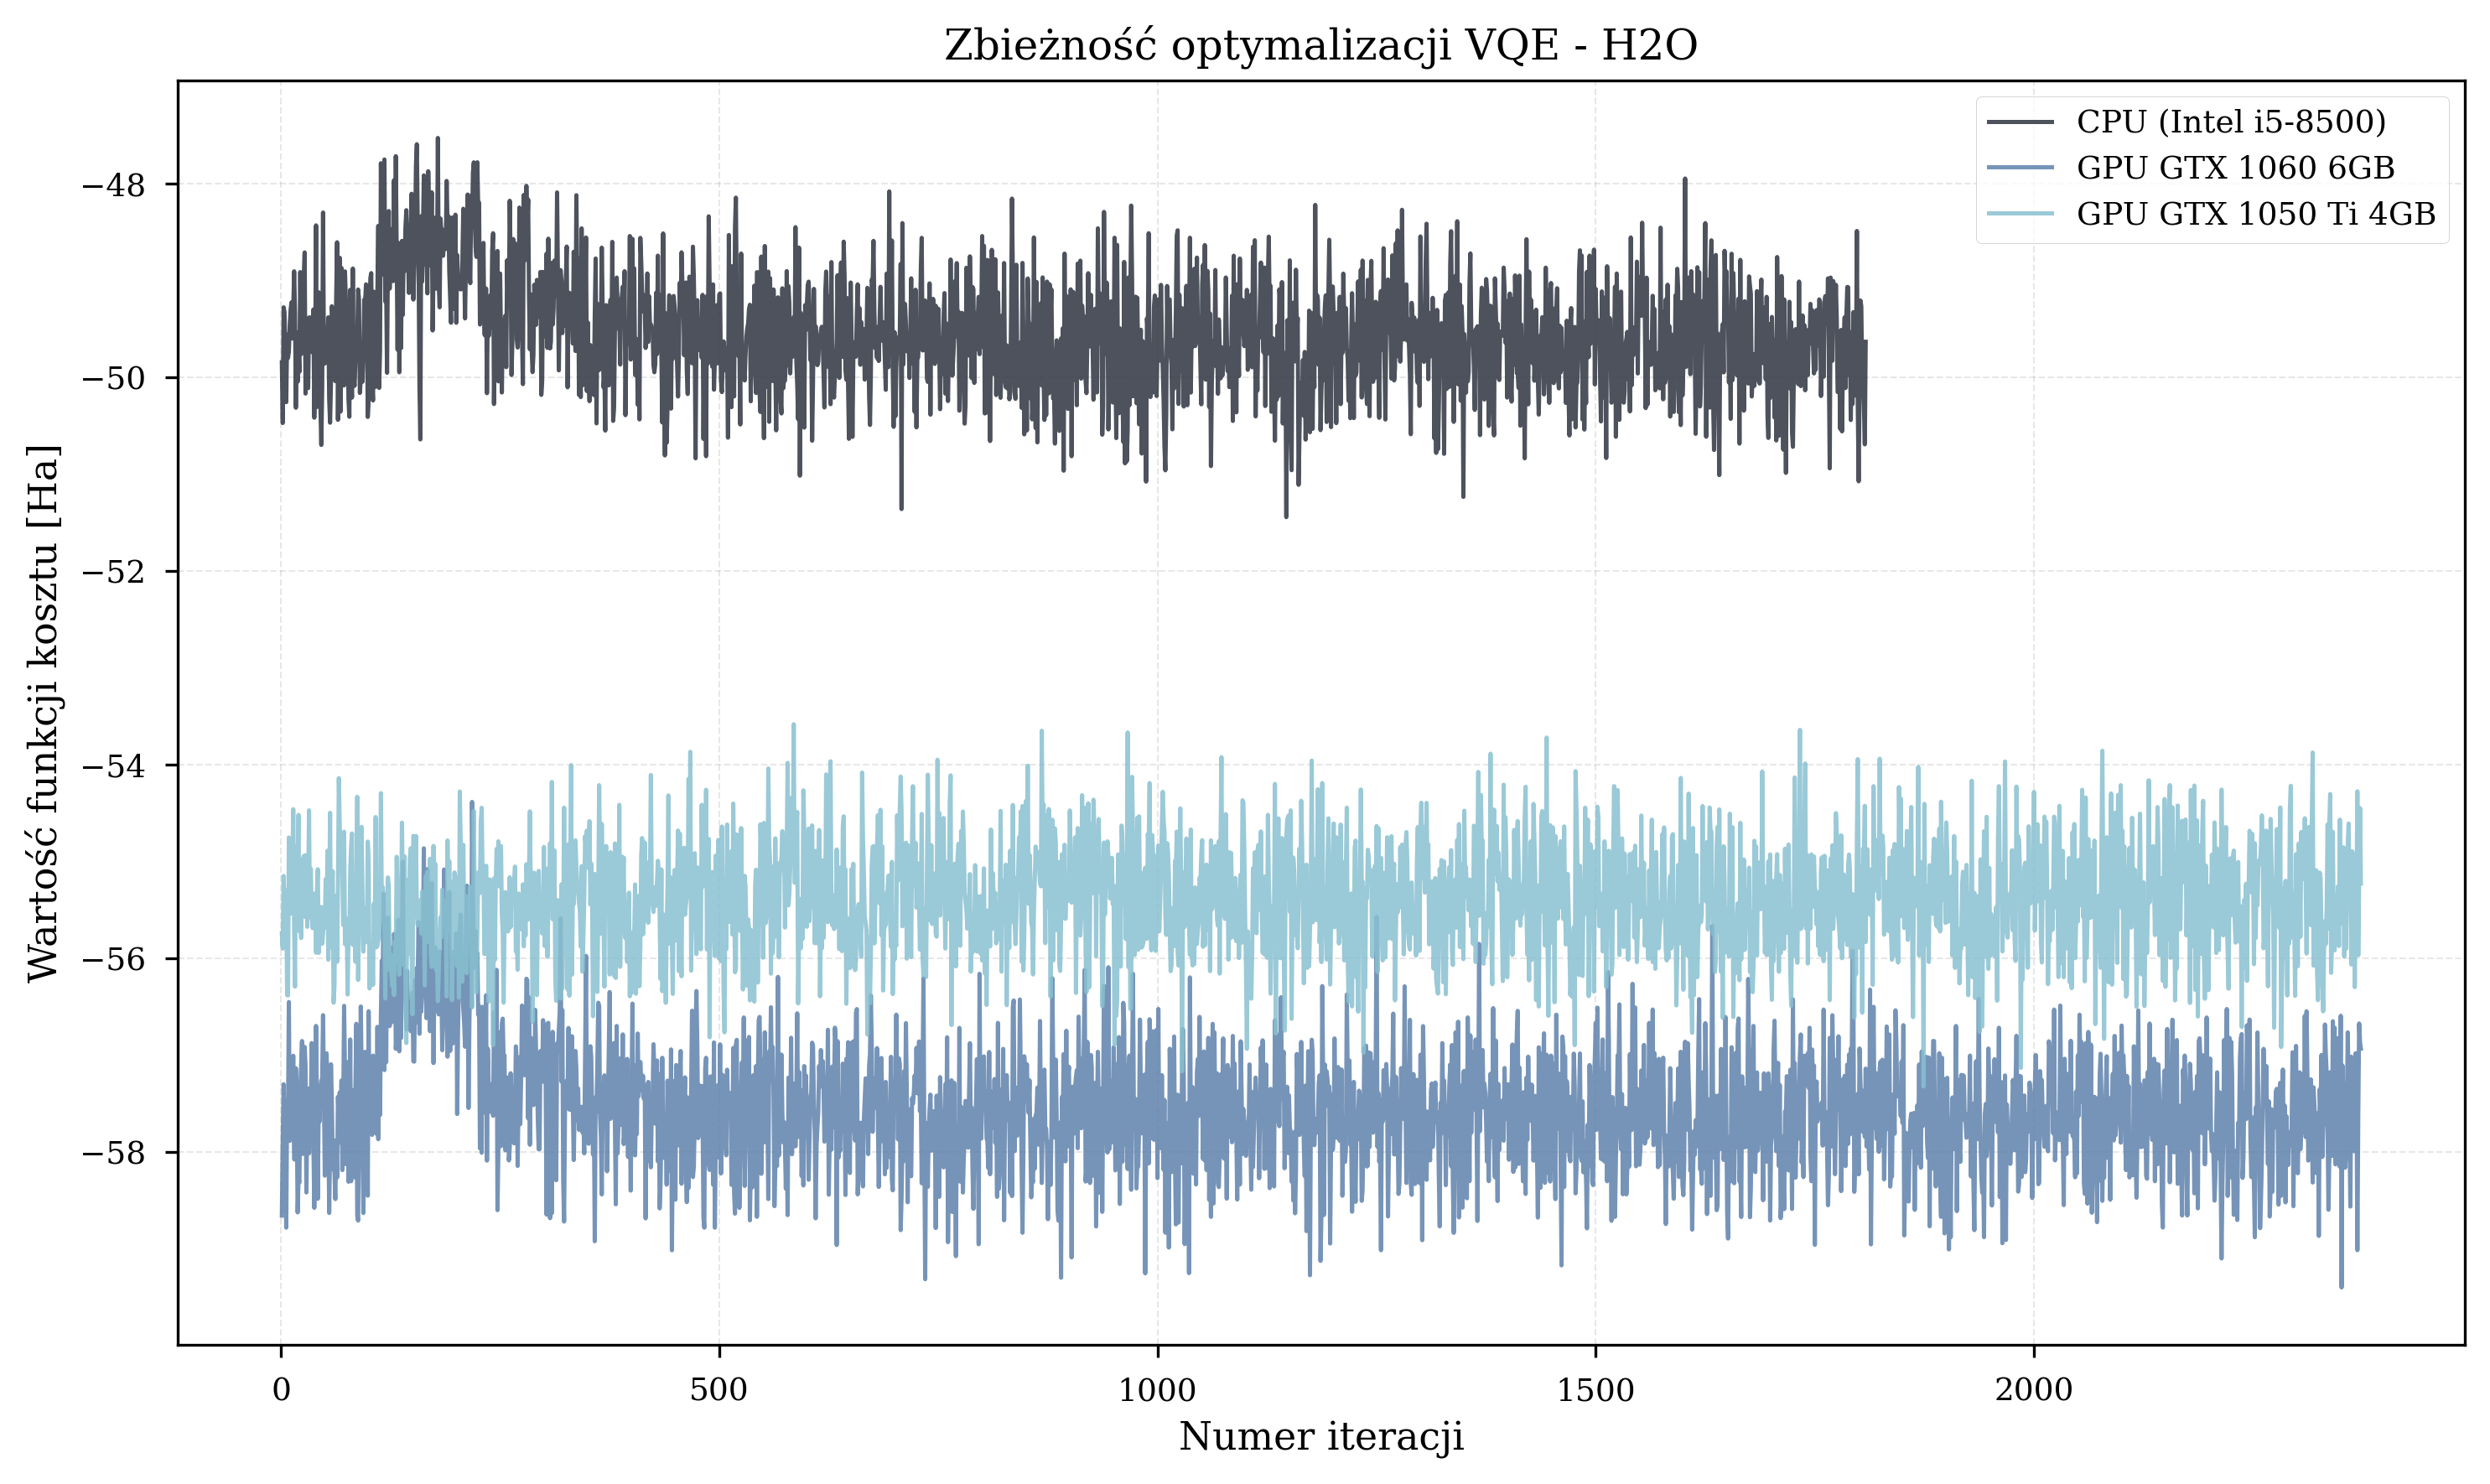
- Large molecules (BeH\(_2\), H\(_2\)O, NH\(_3\), 10-12 qubits): 1,500-2,700 iterations before termination.
Molecule-Specific Trajectories
Energy Results
The final energy values achieved by each configuration provide insight into optimization quality. GPU configurations often achieved lower (better) energy values due to their ability to complete more iterations within the same experimental time budget.
Faster hardware completes more iterations in the same wall-clock time. Under random parameter initialization, more iterations mean a better statistical chance of reaching lower energy values. This is a statistical effect of additional exploration, not an inherent hardware advantage - a GPU does not produce numerically different results for the same parameter trajectory.
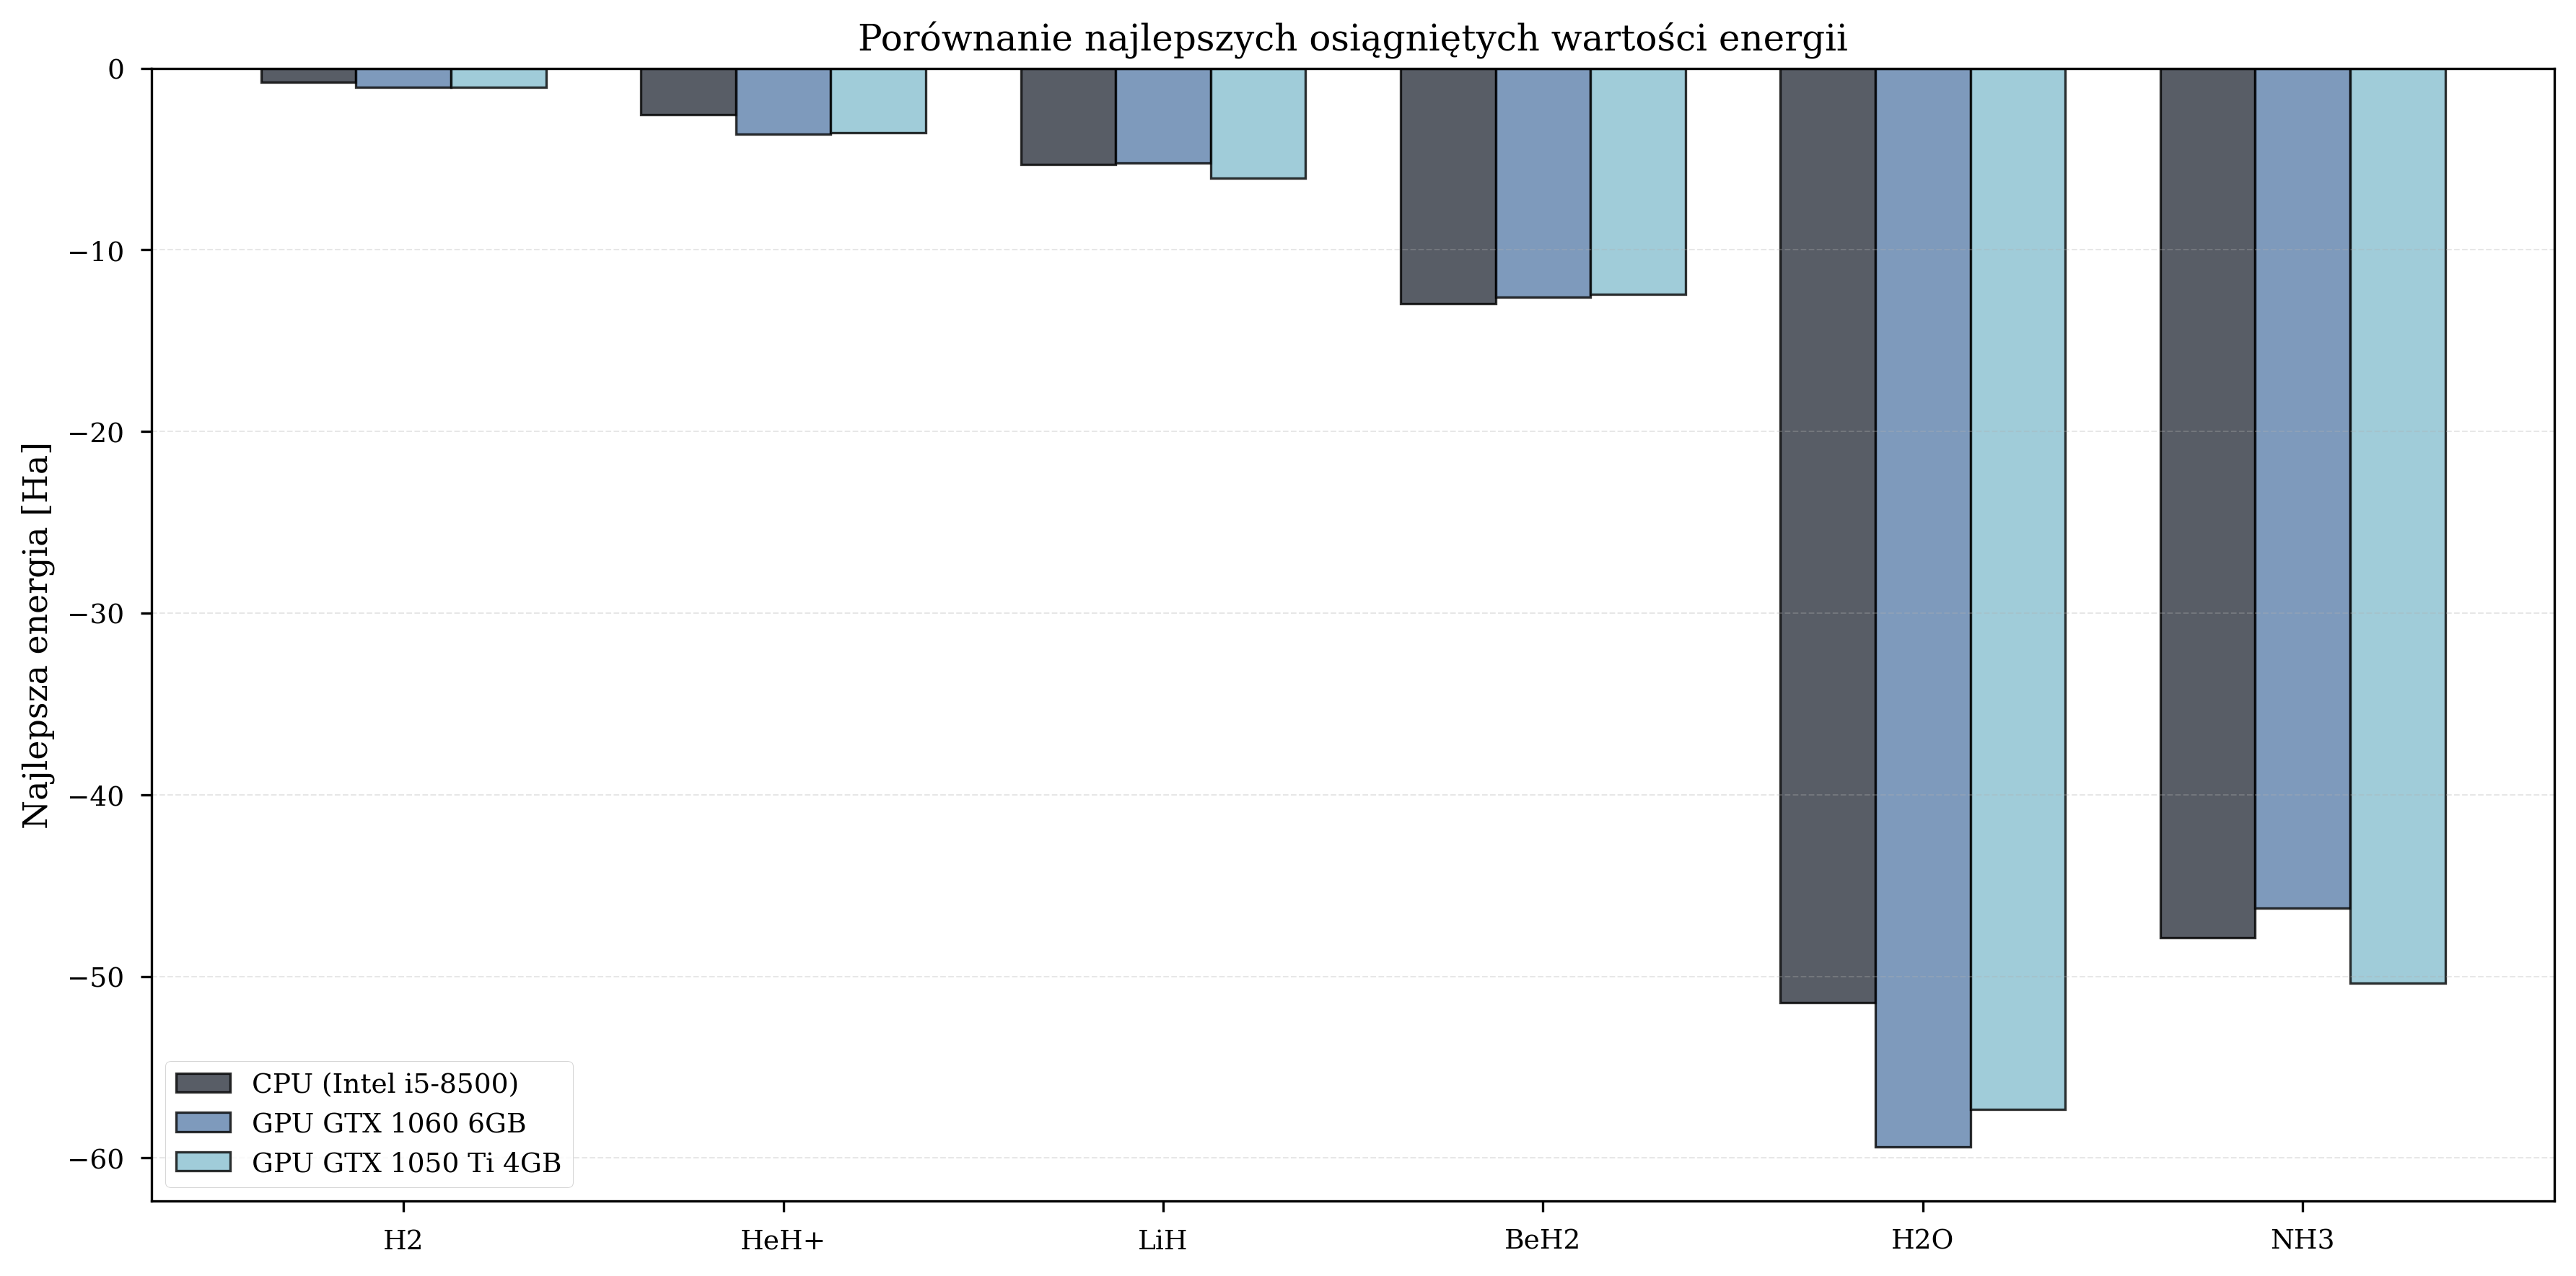
Best Achieved Energies (Ha)
| Molecule | CPU | GPU GTX 1060 | GPU GTX 1050 Ti |
|---|---|---|---|
| H\(_2\) | -0.79 | -1.05 | -1.07 |
| LiH | -5.32 | -5.23 | -6.05 |
| BeH\(_2\) | -12.98 | -12.60 | -12.46 |
| H\(_2\)O | -51.44 | -59.40 | -57.32 |
| NH\(_3\) | -47.88 | -46.26 | -50.36 |
Best energies varied across configurations, consistent with the stochastic nature of random initialization.
Comparison with Reference Values
Best VQE results compared against literature values for the STO-3G basis set:
| Molecule | Best VQE (Ha) | Literature (Ha) | Method | Relative Error |
|---|---|---|---|---|
| H\(_2\) | -1.07 | -1.117 | HF/STO-3G | 4.2% |
| HeH\(^+\) | -3.65 | -2.927 | Full CI/STO-3G | 24.7% |
| LiH | -6.05 | -7.882 | CCSD/STO-3G | 23.2% |
| BeH\(_2\) | -12.98 | -15.15 | FCI/CAS/STO-3G | 14.3% |
| H\(_2\)O | -59.40 | -74.963 | HF/STO-3G | 20.8% |
| NH\(_3\) | -50.36 | -55.454 | HF/STO-3G | 9.2% |
H\(_2\) is within 4.2% of the Hartree-Fock reference. Larger molecules show 9-25% errors, primarily due to random parameter initialization and local minima entrapment. The thesis did not test alternative initialization strategies.
HeH+ energy anomaly: sub-FCI result
The HeH\(^+\) VQE result (-3.65 Ha) is lower than the exact Full CI reference value (-2.927 Ha), which appears to violate the variational principle (\(E_{\text{VQE}} \geq E_{\text{exact}}\)). This occurs because the EfficientSU2 ansatz does not enforce particle number conservation or spin symmetry. The optimizer can therefore find states in the qubit Hilbert space that have lower energy eigenvalues of the qubit Hamiltonian but do not correspond to valid electronic states with the correct number of electrons. Such unphysical sub-FCI energies are a known artifact of hardware-efficient ansatze that lack symmetry constraints (Tilly et al. 2022, Section 4.3). Symmetry-preserving ansatze or post-selection techniques would eliminate this issue at the cost of increased circuit complexity.
Reference value sources:
| Molecule | Reference Value | Source |
|---|---|---|
| H\(_2\): -1.117 Ha | HF/STO-3G | NIST CCCBDB 2023; Szabo & Ostlund 1996, p.108 |
| HeH\(^+\): -2.927 Ha | Full CI/STO-3G | Szabo & Ostlund 1996, p.178, Table 3.6 |
| LiH: -7.882 Ha | CCSD/STO-3G | Avramidis et al. 2024 (AIP Advances); Szabo & Ostlund 1996, p.286 |
| BeH\(_2\): -15.15 Ha | FCI/CAS/STO-3G | Belaloui et al. 2024 (arXiv:2412.02606); Feldmann et al. 2024 |
| H\(_2\)O: -74.963 Ha | HF/STO-3G | Szabo & Ostlund 1996, p.192, Table 3.13 |
| NH\(_3\): -55.454 Ha | HF/STO-3G | Martin 1996 (Chem. Phys. Lett. 259), p.674, Table 5 |
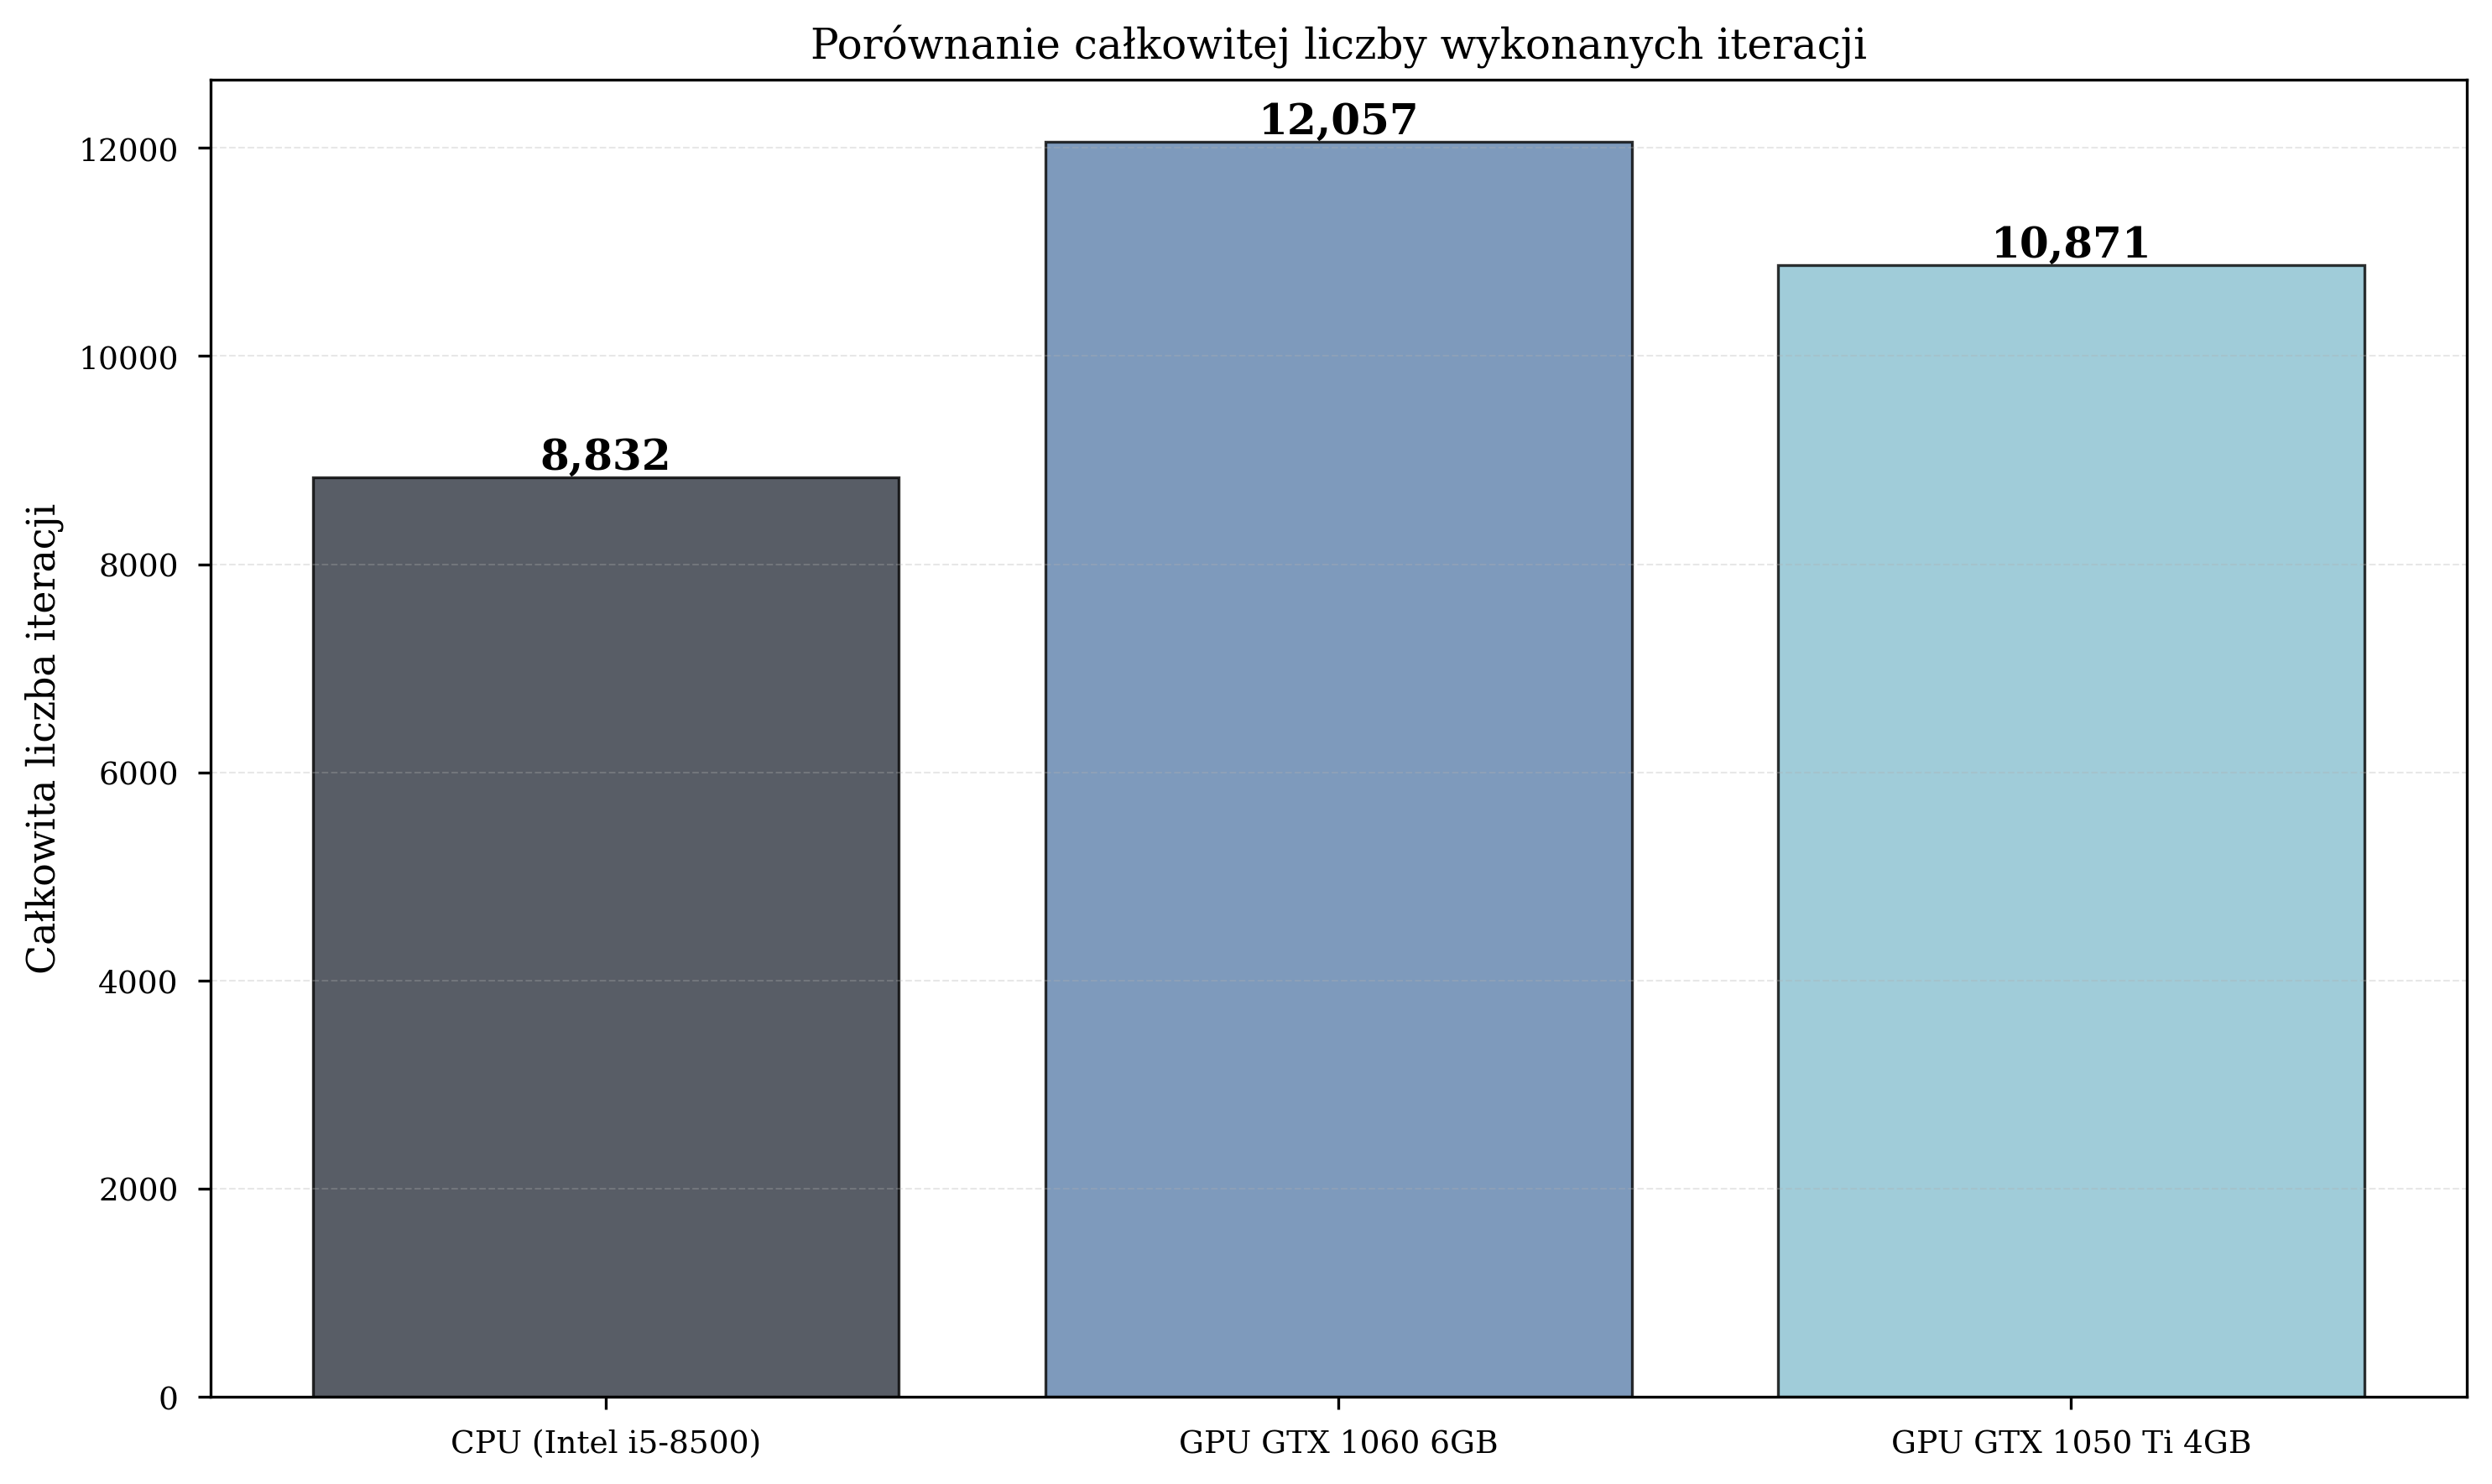
CPU vs. GPU Performance
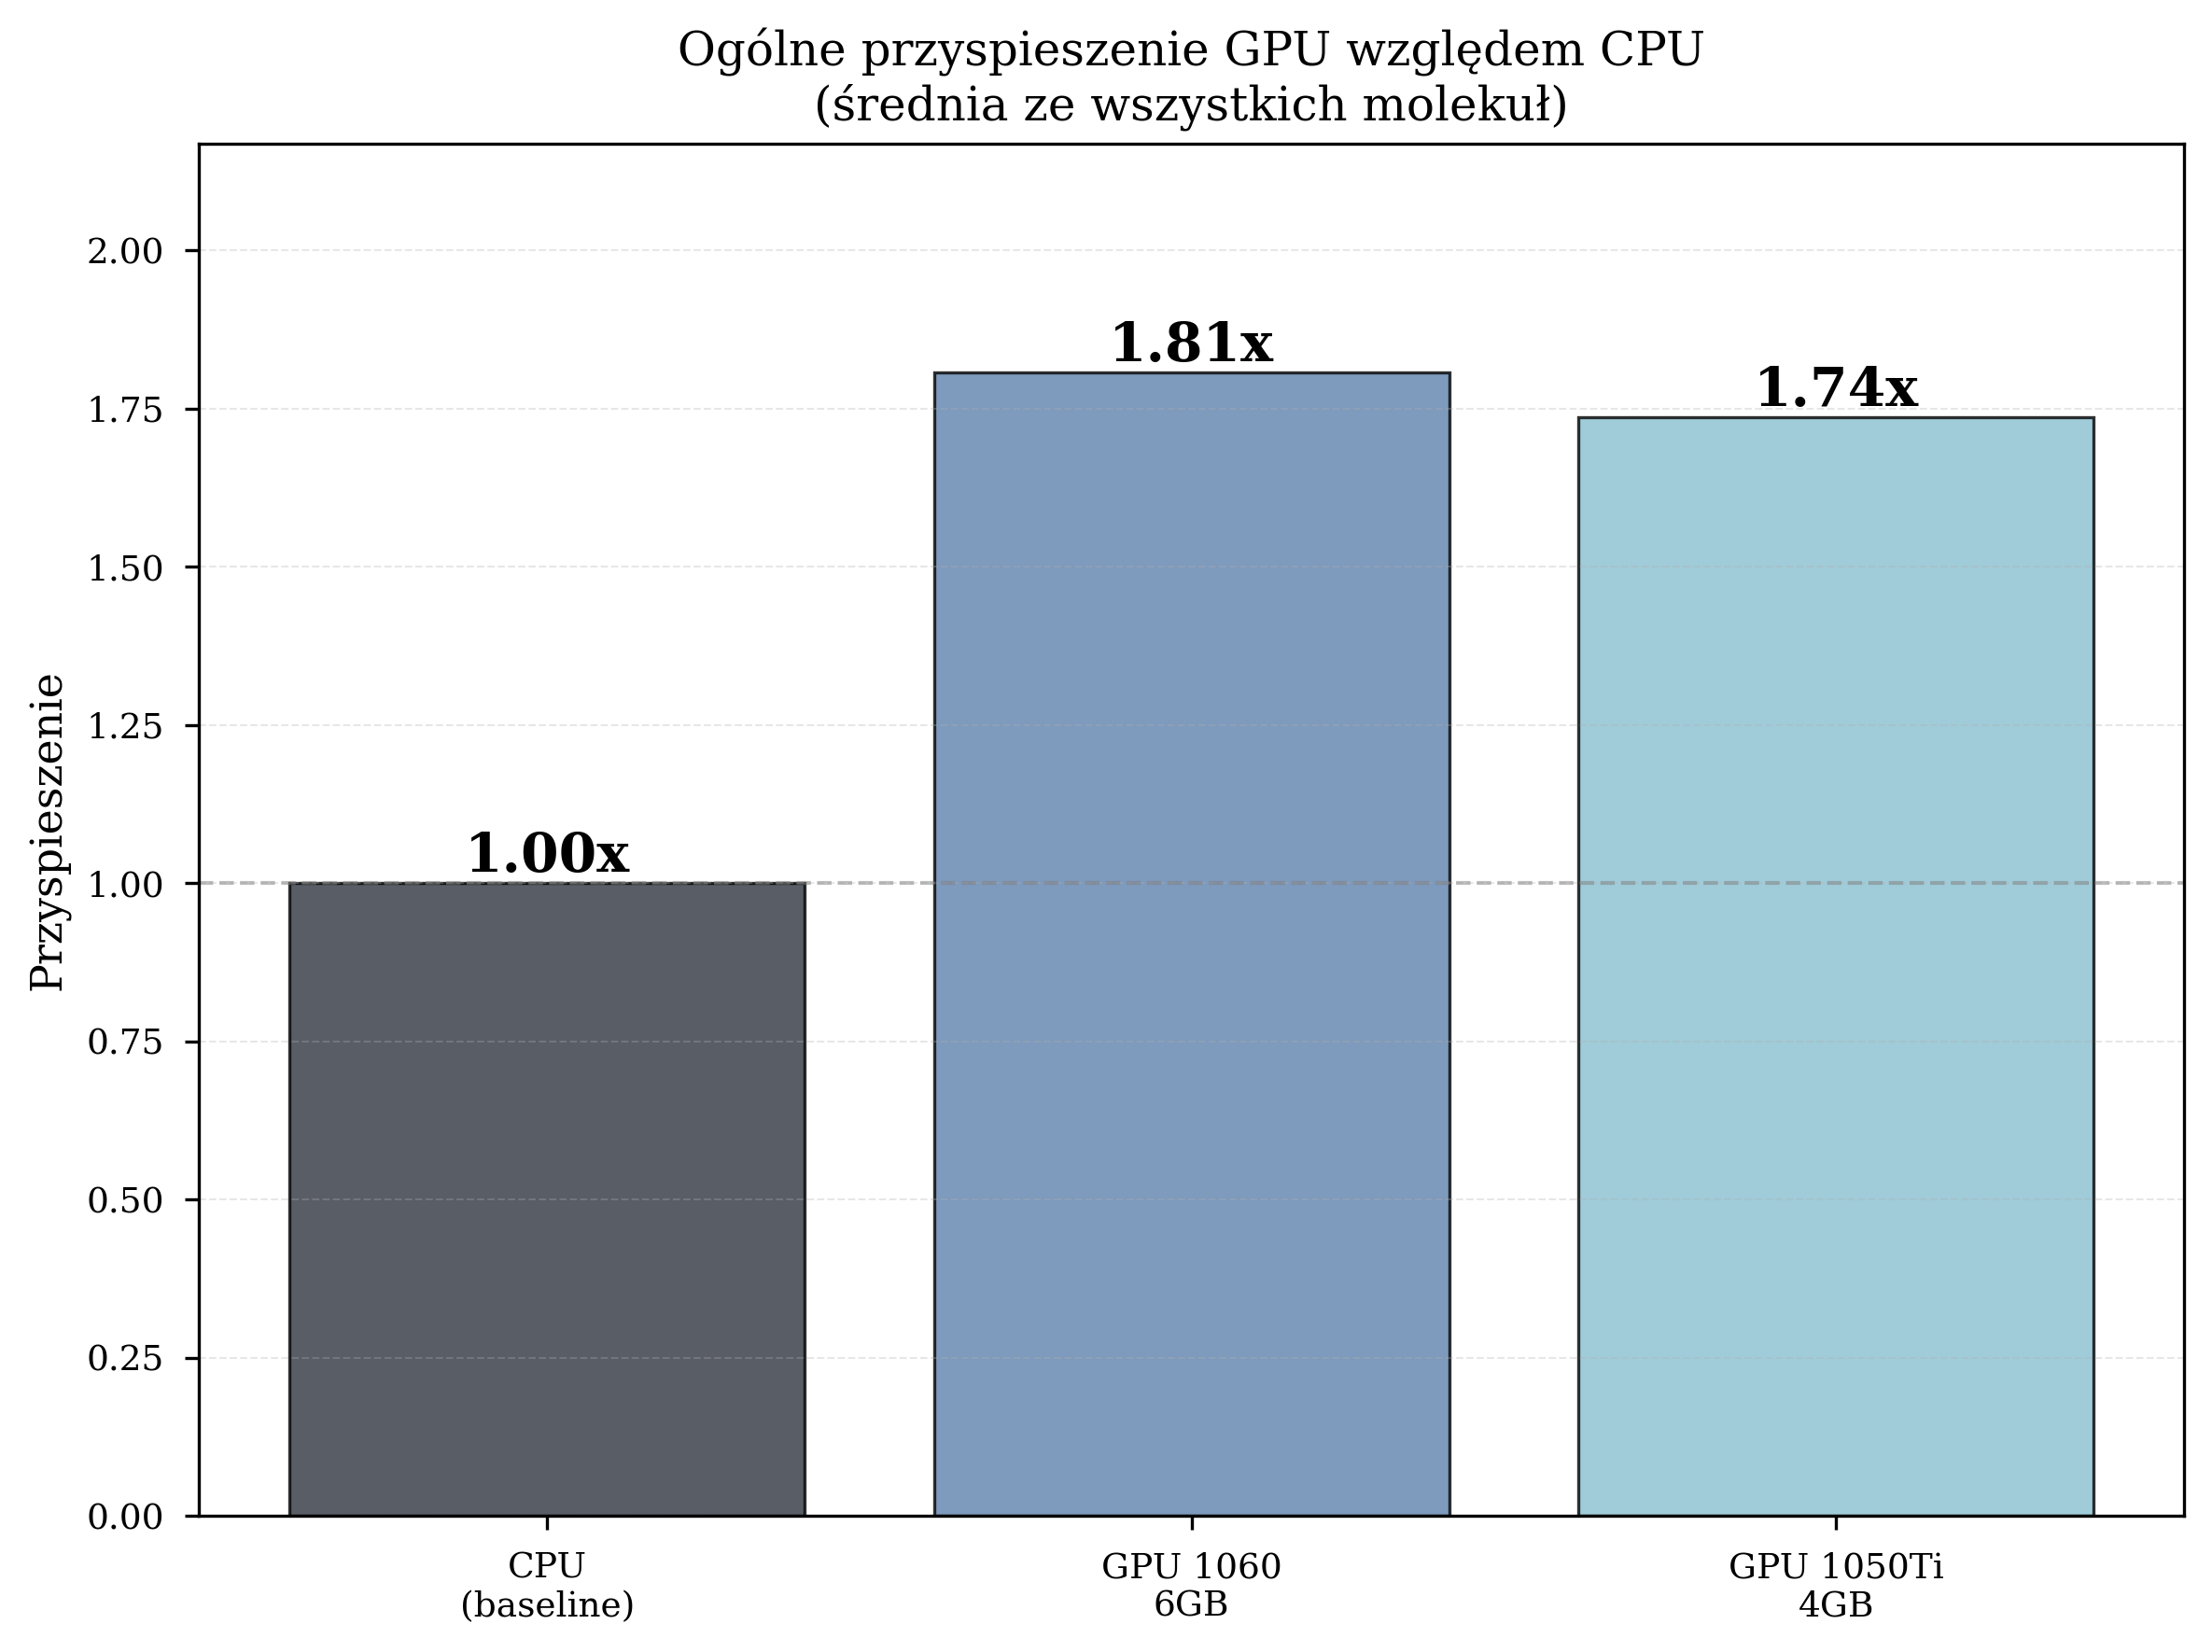
Overall Speedup
Aggregate performance statistics across all experimental runs:
| Configuration | Avg. Time/Iteration (s) | Total Iterations | Speedup |
|---|---|---|---|
| CPU (Intel i5-8500) | 4.259 | 8,832 | 1.00x (baseline) |
| GPU GTX 1060 6GB | 2.357 | 12,057 | 1.81x |
| GPU GTX 1050 Ti 4GB | 2.454 | 10,871 | 1.74x |
The GPU GTX 1060, with its higher CUDA core count (1280 vs. 768) and greater VRAM capacity (6 GB vs. 4 GB), consistently outperforms the GTX 1050 Ti. However, both GPUs deliver meaningful acceleration over the CPU baseline.
Critically, the GPU configurations also completed a substantially greater total number of iterations: GPU1 executed 36% more iterations than CPU (12,057 vs. 8,832), enabling more thorough exploration of the parameter space.
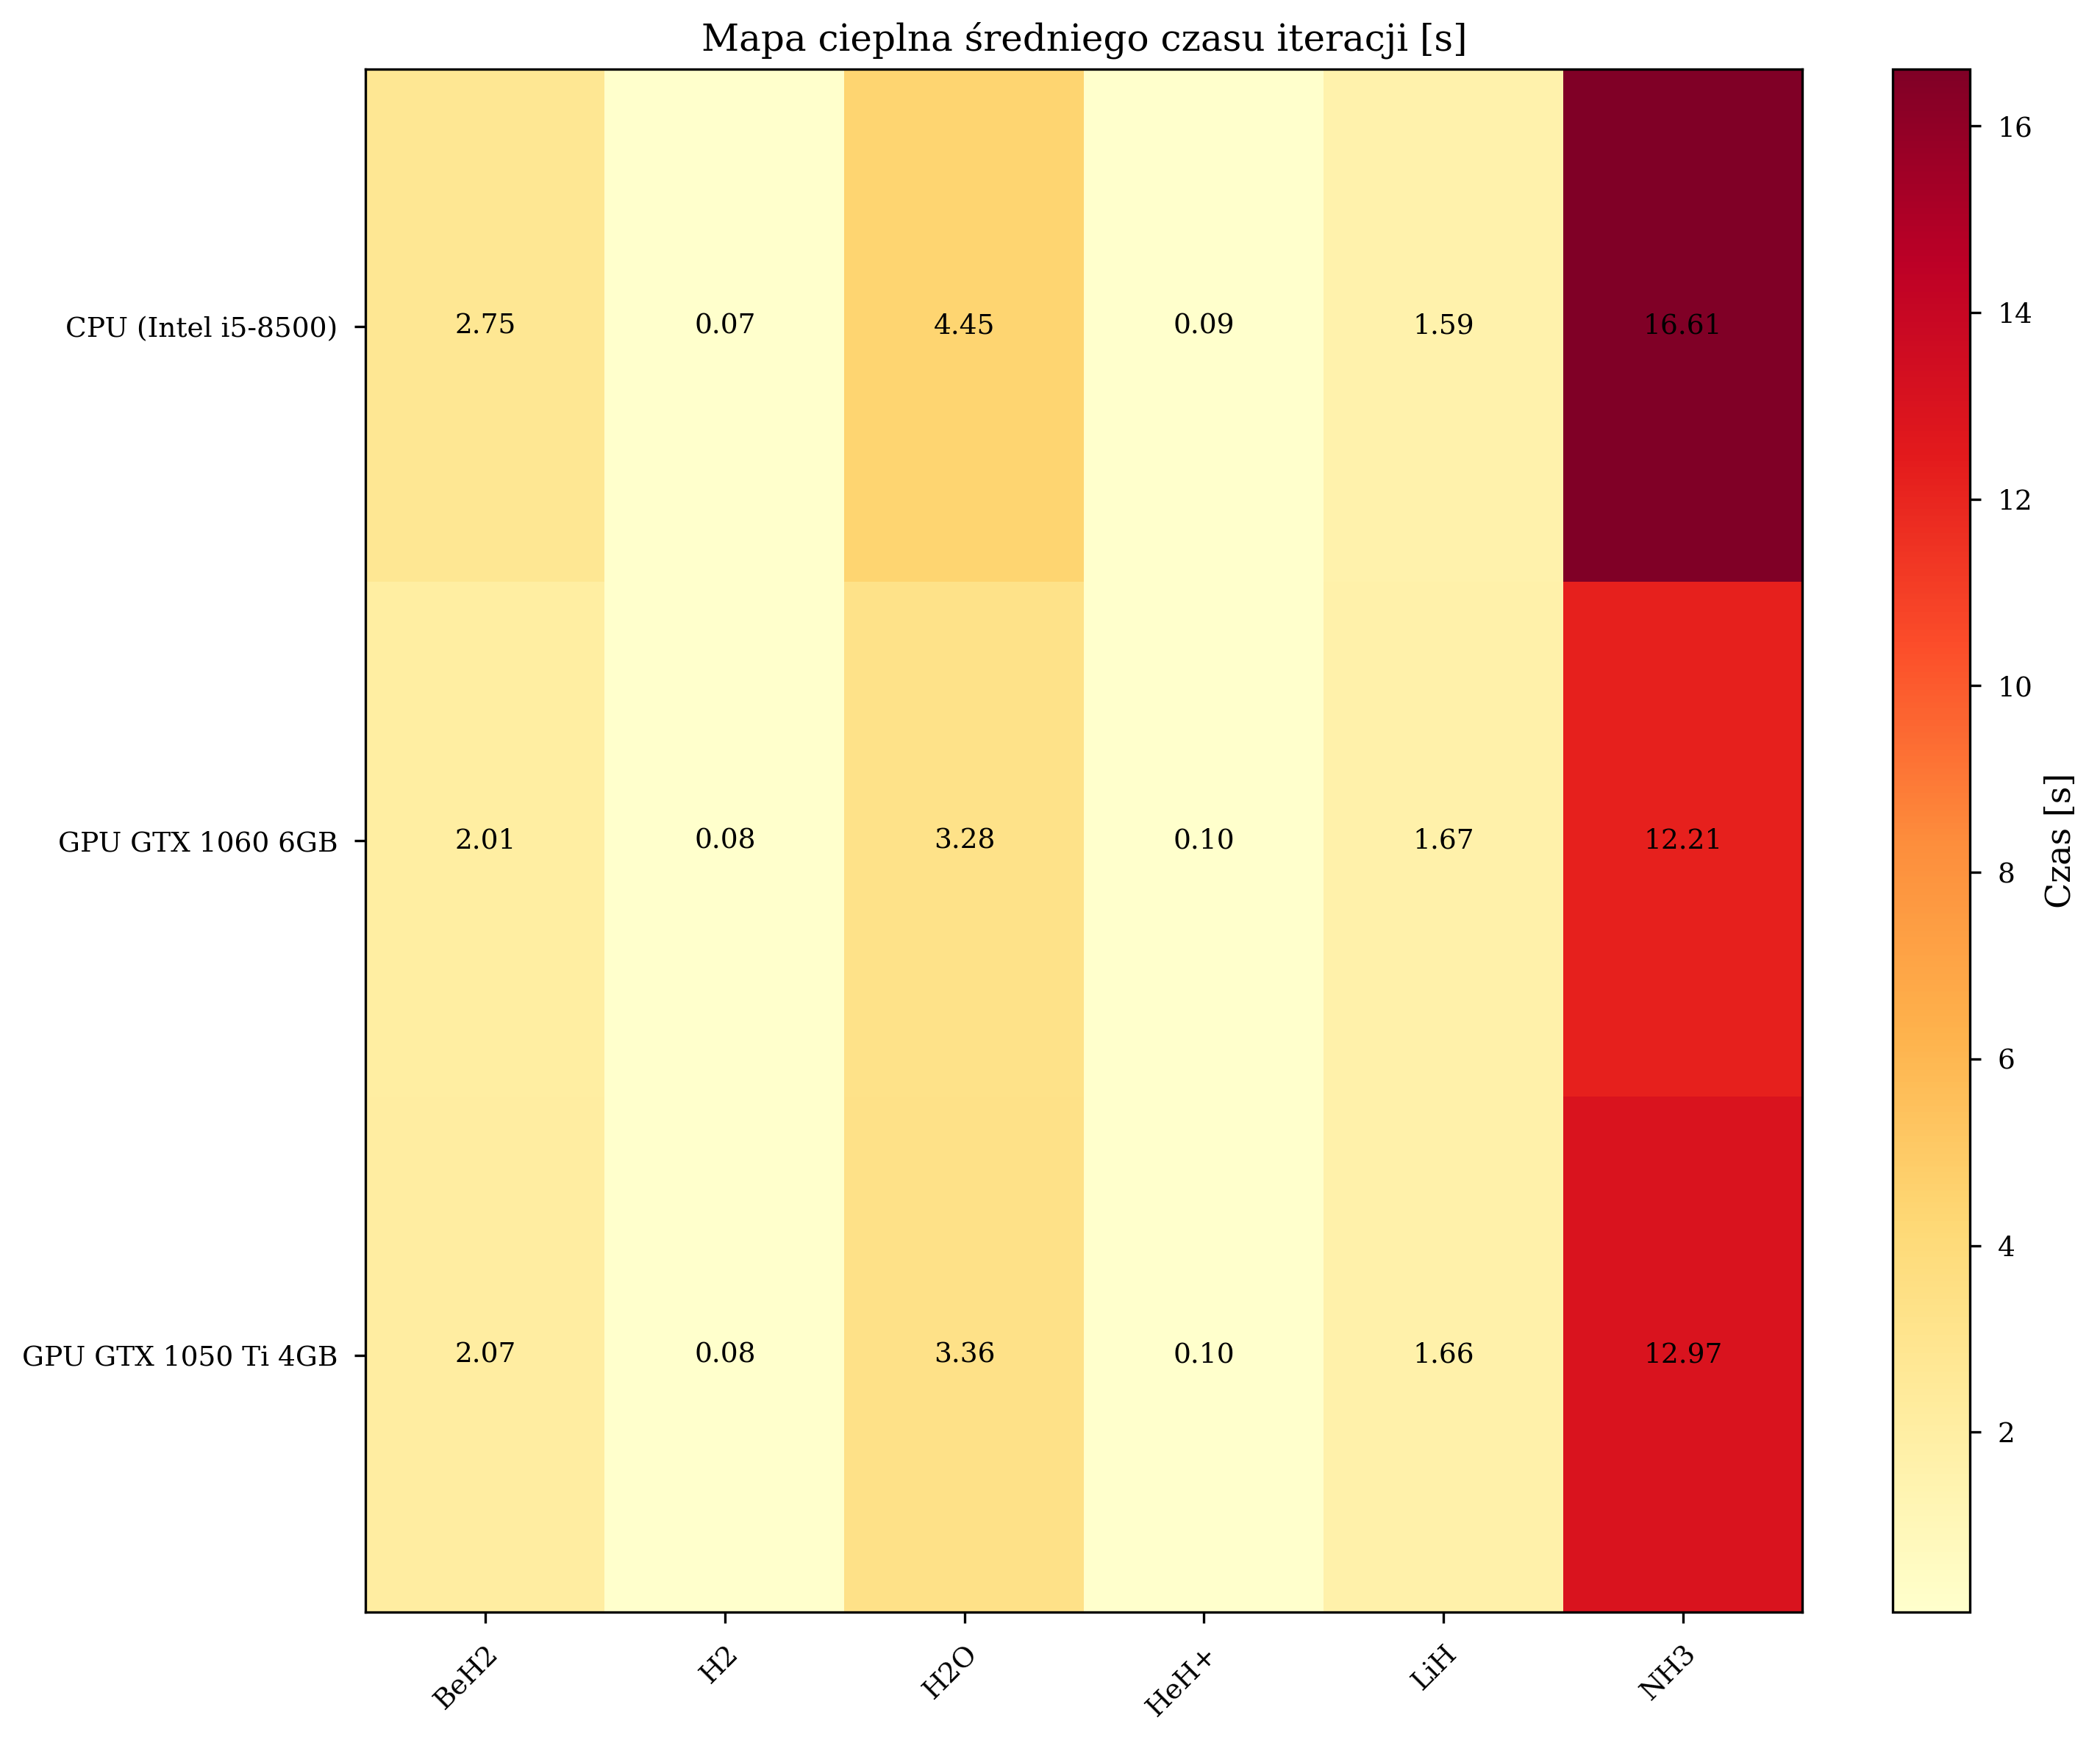
Iteration Time Analysis
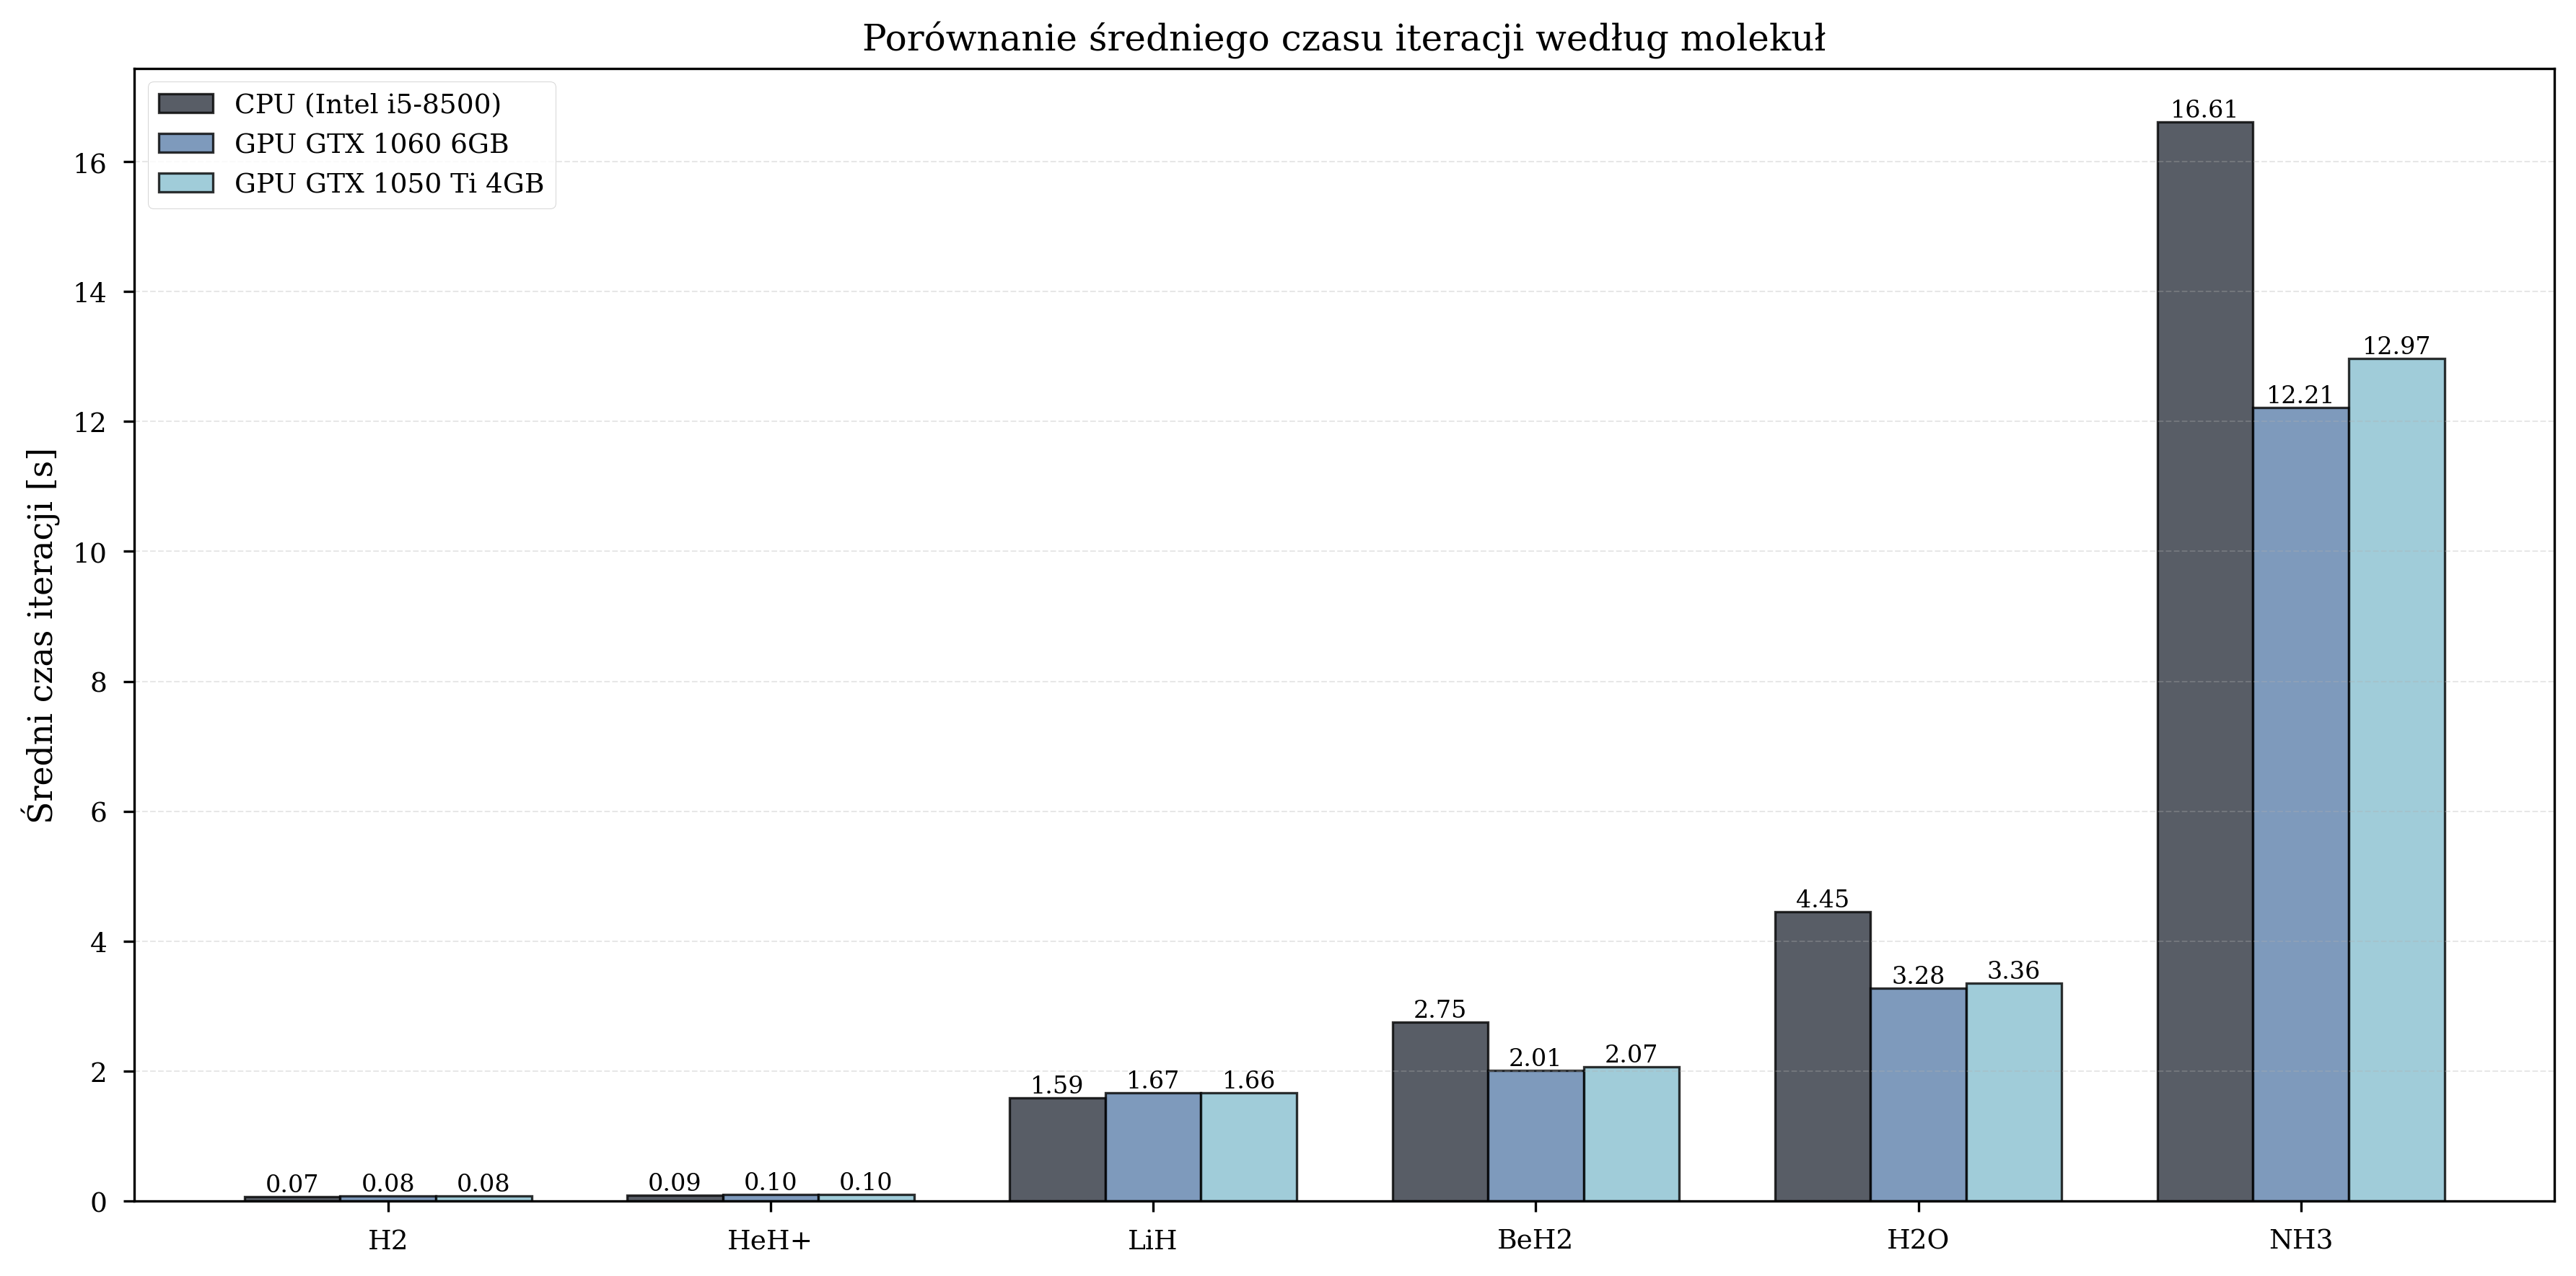
Scaling with Molecular Complexity
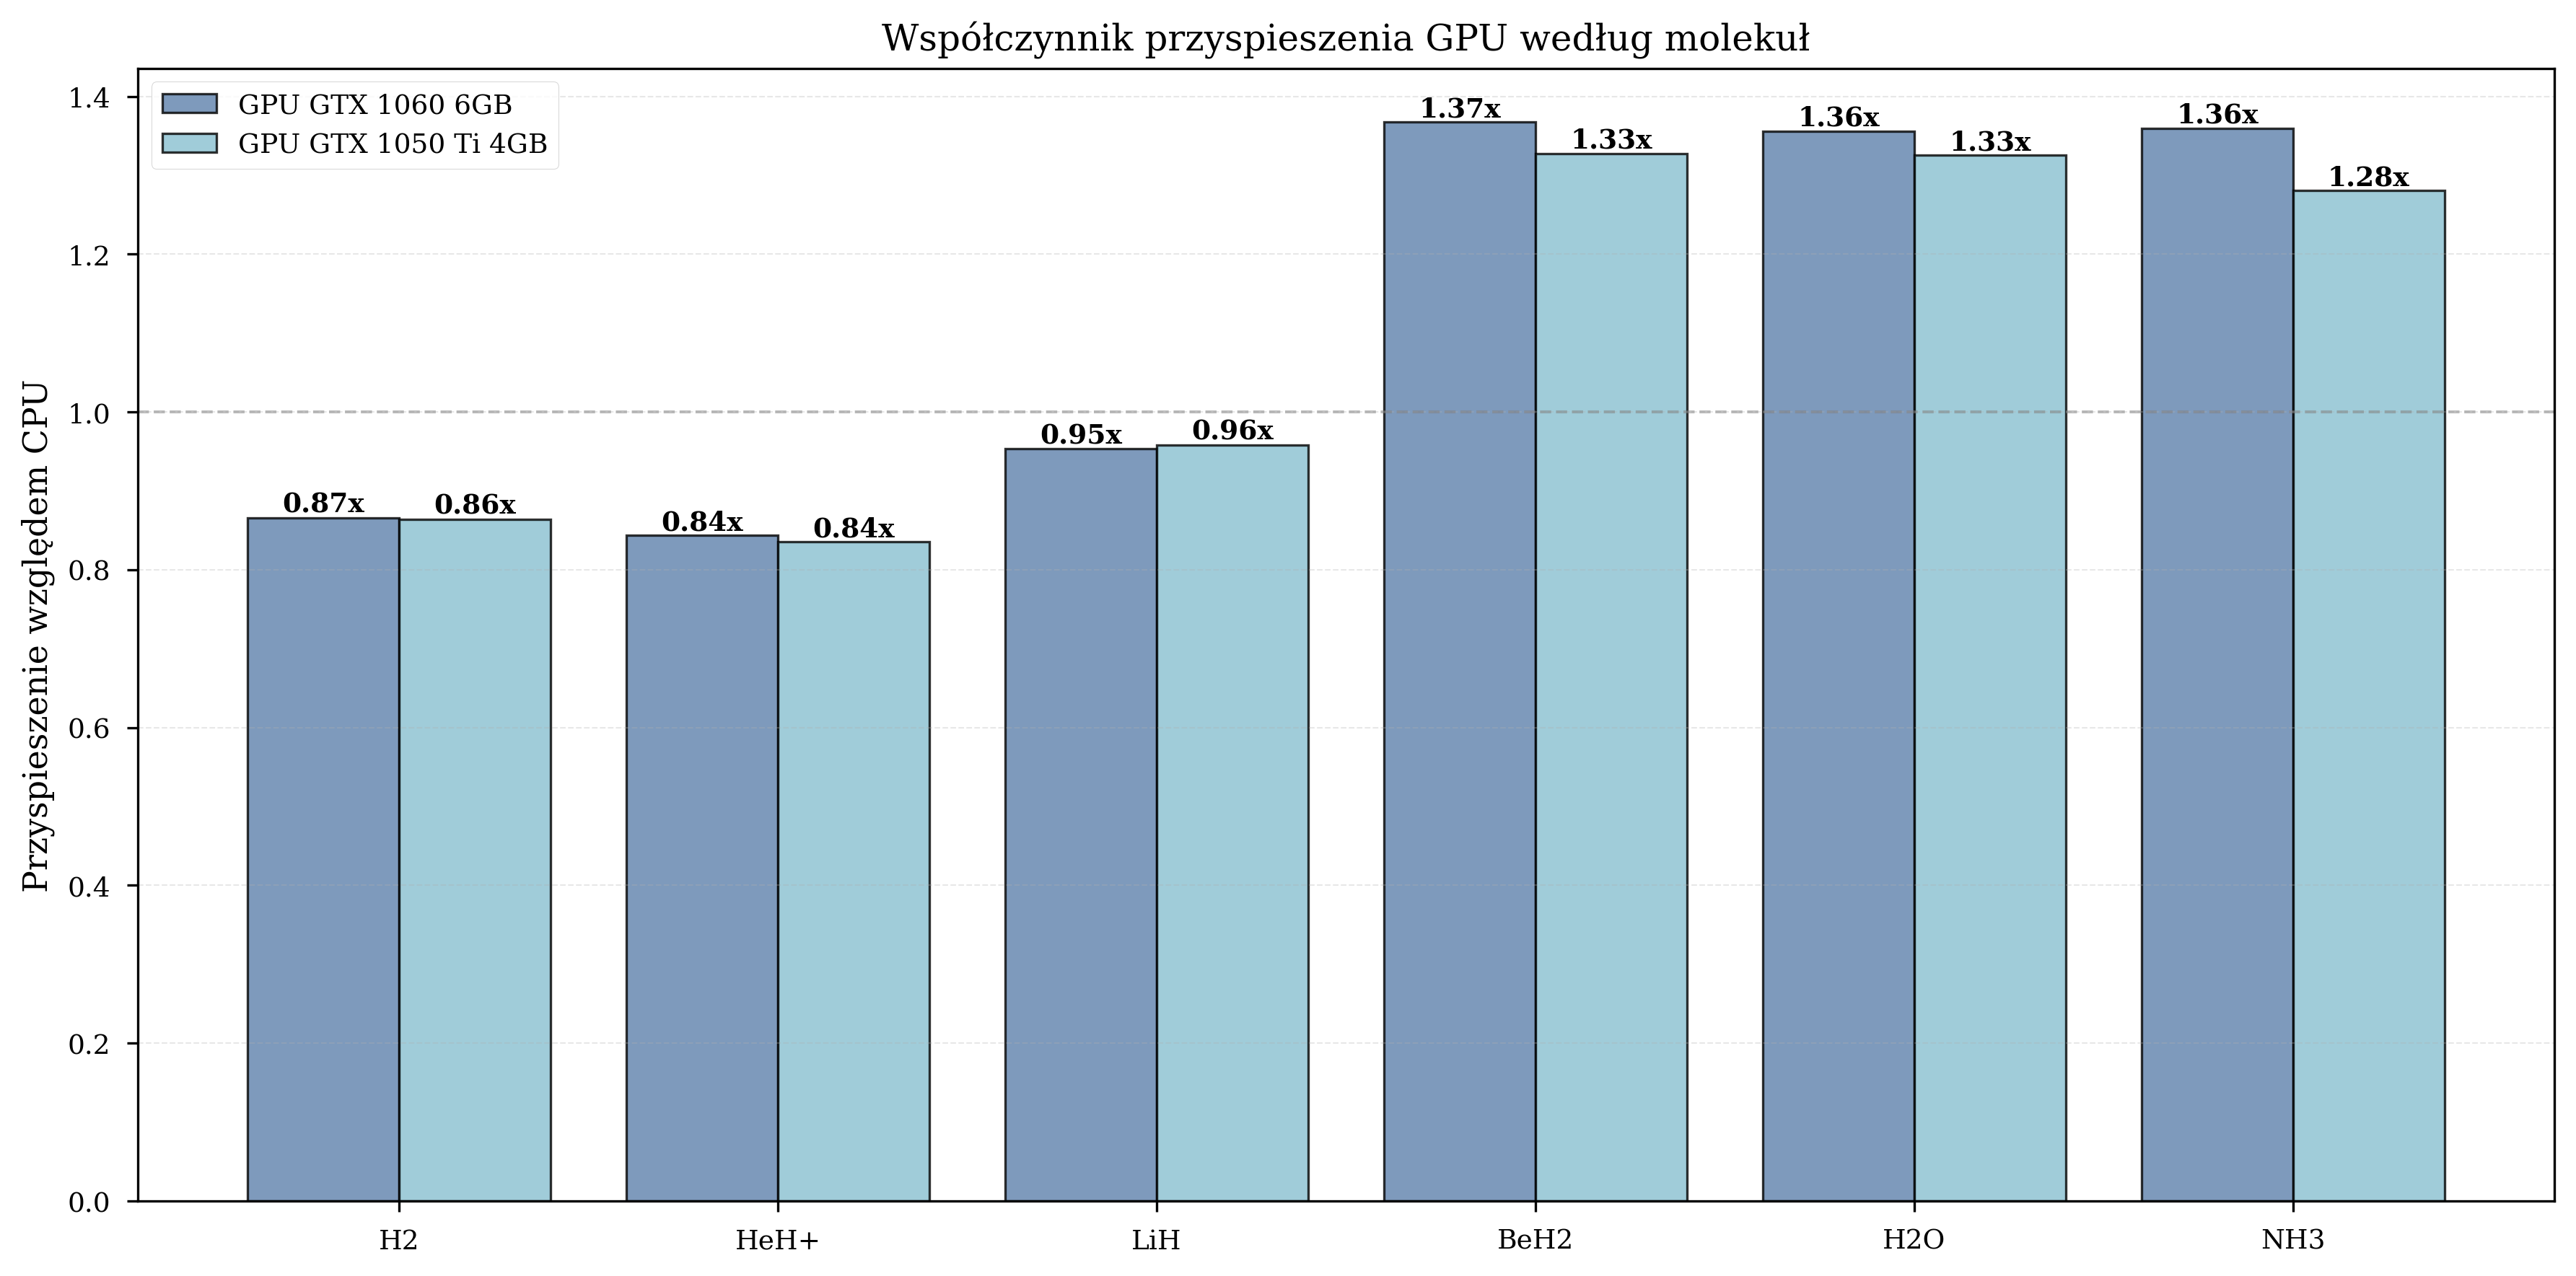
Measured GPU speedup by molecule:
| Molecule | Qubits | Avg. Iterations | GPU Speedup Range |
|---|---|---|---|
| H\(_2\) | 4 | 650 | 0.8-1.0x (GPU overhead dominates) |
| HeH\(^+\) | 4 | 630 | 0.9-1.1x (marginal benefit) |
| LiH | 8 | 1,455 | 1.5-1.6x (moderate) |
| BeH\(_2\) | 10 | 2,373 | 1.8-2.1x (significant) |
| H\(_2\)O | 12 | 2,185 | 1.3-1.4x (moderate) |
| NH\(_3\) | 12 | 2,410 | 1.3-1.4x (moderate) |
For small molecules (4 qubits), the overhead of data transfer between CPU and GPU memory negates the computational advantage. The crossover point occurs at approximately 8 qubits, beyond which GPU acceleration provides consistent benefits. The peak speedup of 1.8-2.1x is observed for BeH\(_2\) (10 qubits), after which the speedup stabilizes at 1.3-1.4x for 12-qubit systems.
Iteration Count Comparison
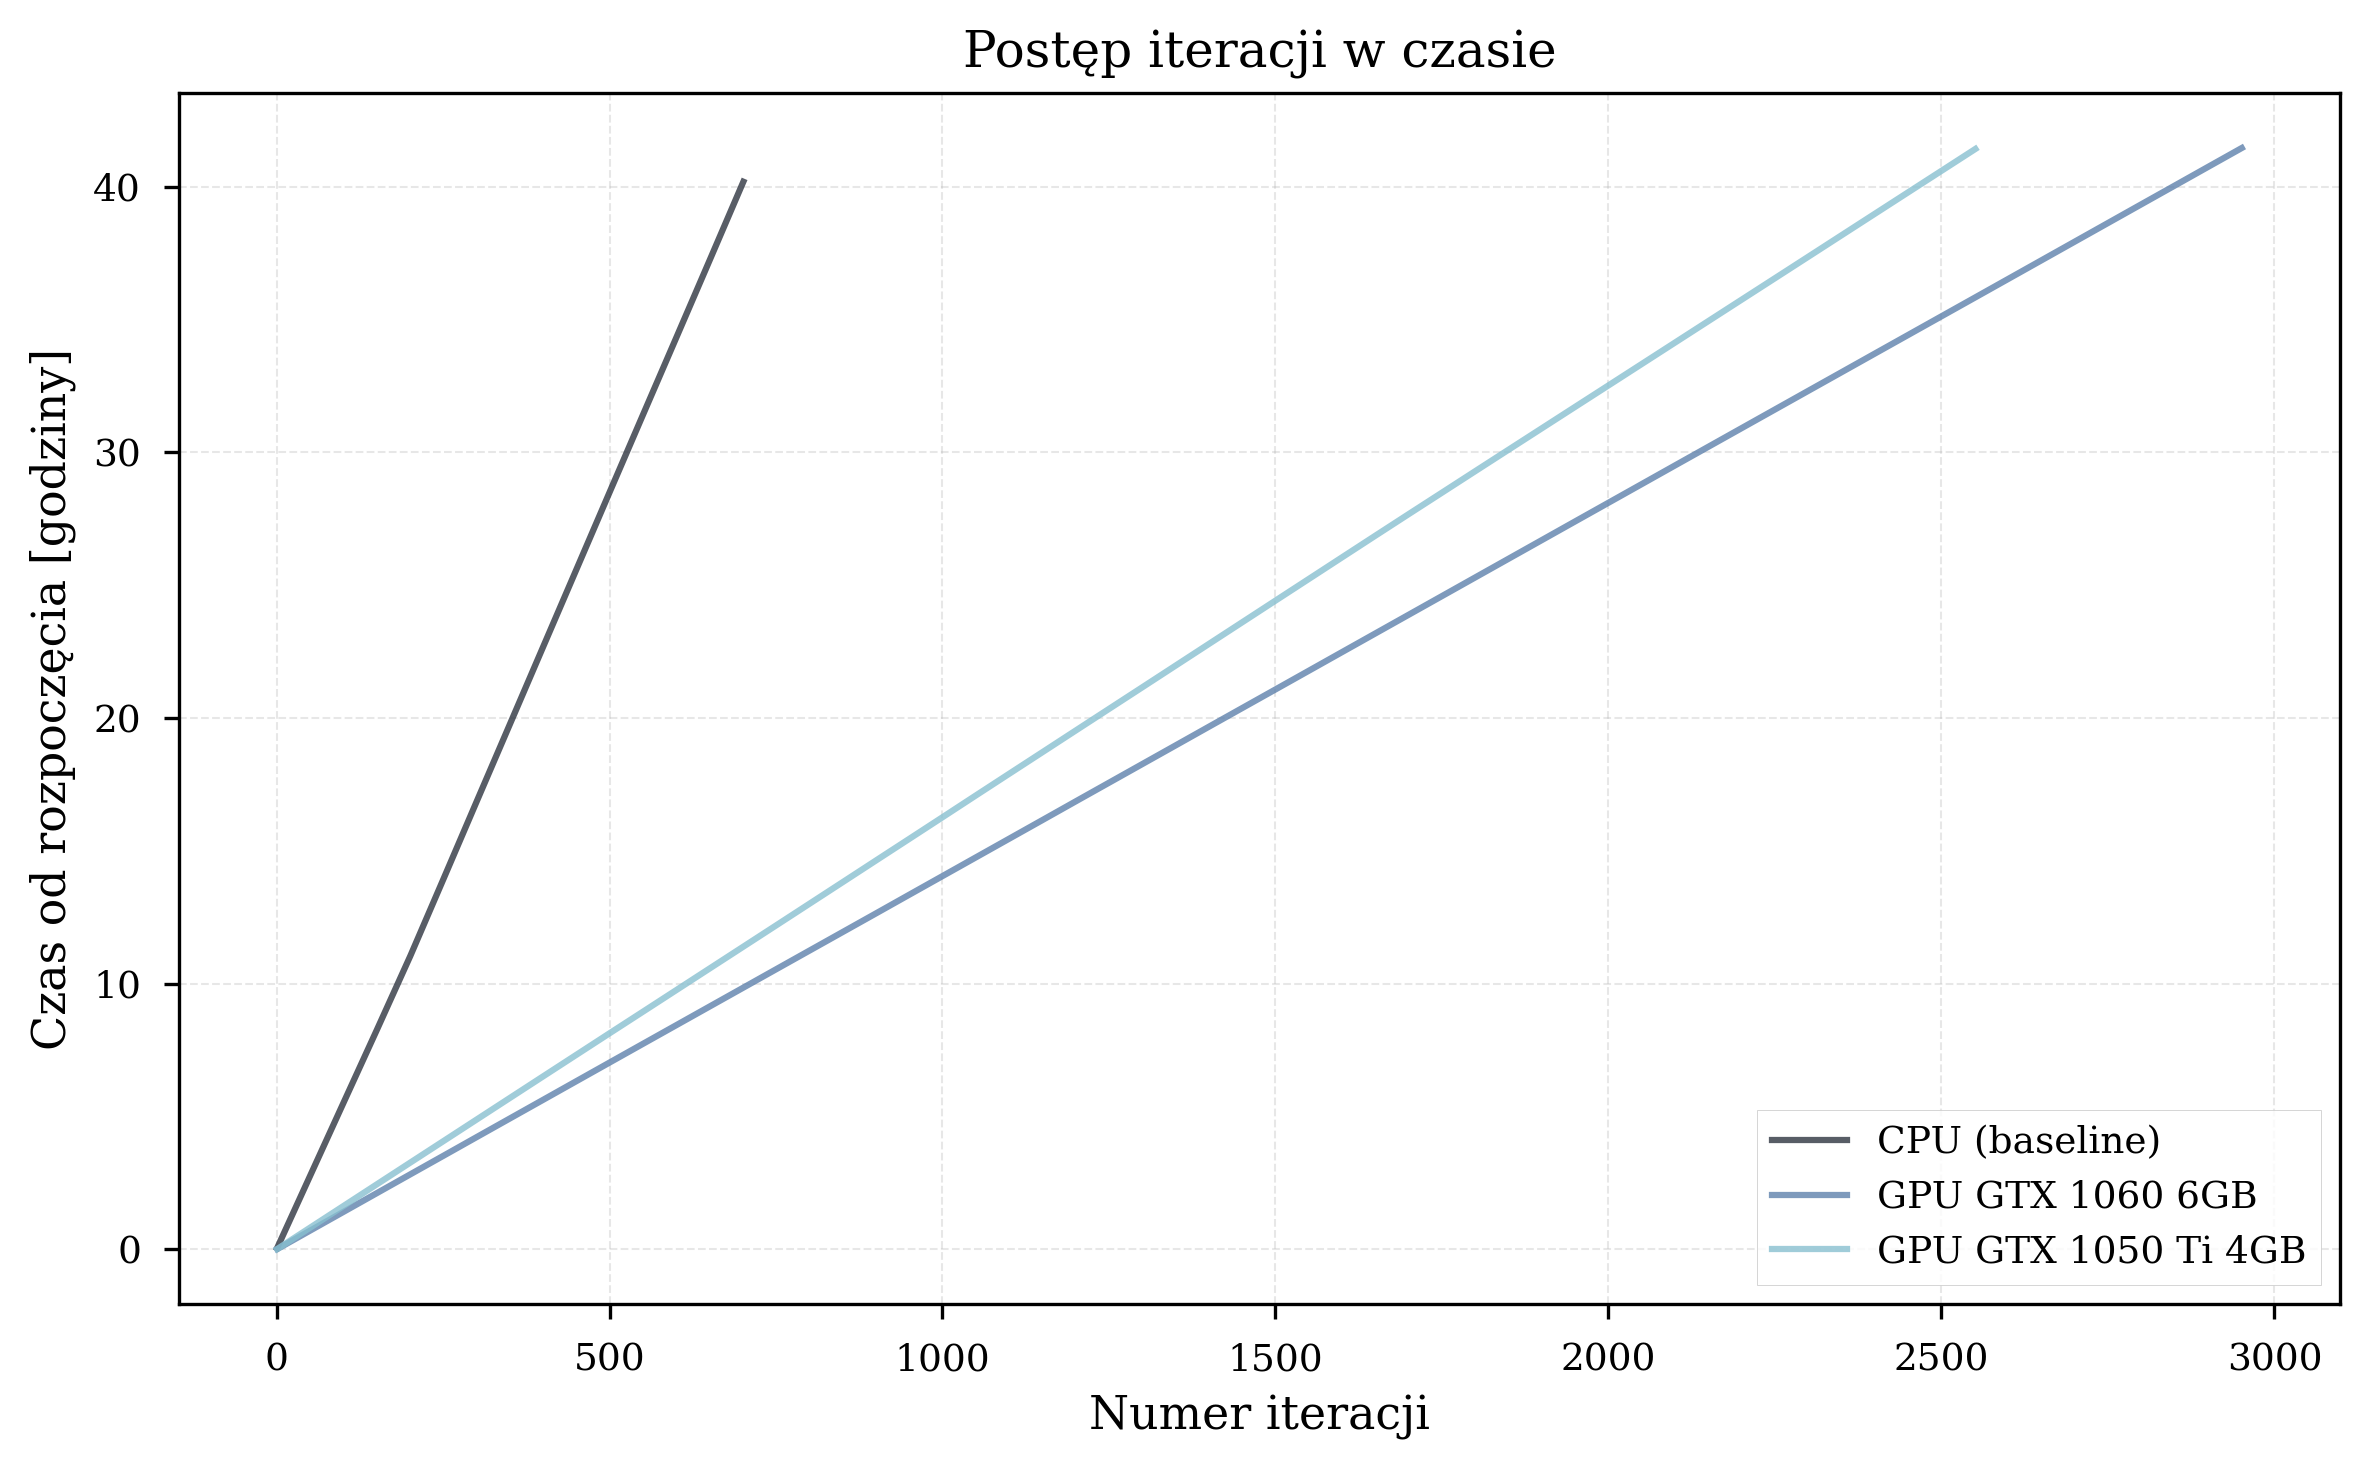
Time vs. Iterations
Speedup Summary
Practical Implications
In practical terms, a VQE simulation campaign requiring 7 days of CPU computation can be completed in approximately 4 days on a GTX 1060 GPU. For workflows involving many molecular configurations, this compounds significantly.
Basis Set Impact
STO-3G Performance (Primary Experiments)
All primary benchmarking experiments utilized the STO-3G basis set, which provides a computationally efficient baseline with 4-12 qubits for the tested molecular systems. The results presented in the preceding sections - speedup factors of 1.74-1.81x, convergence within hundreds to thousands of iterations --- are representative of STO-3G performance.
CC-pVDZ Performance (Extended Experiments)
Additional experiments were conducted with the cc-pVDZ basis set on H\(_2\) only (due to computational constraints).
| Configuration | STO-3G Time/Iter (s) | cc-pVDZ Time/Iter (s) | Slowdown |
|---|---|---|---|
| CPU (i5-8500) | ~4.3 | 206.19 | ~48x |
| GPU GTX 1060 | ~2.4 | 50.55 | ~21x |
| GPU GTX 1050 Ti | ~2.5 | 58.42 | ~23x |
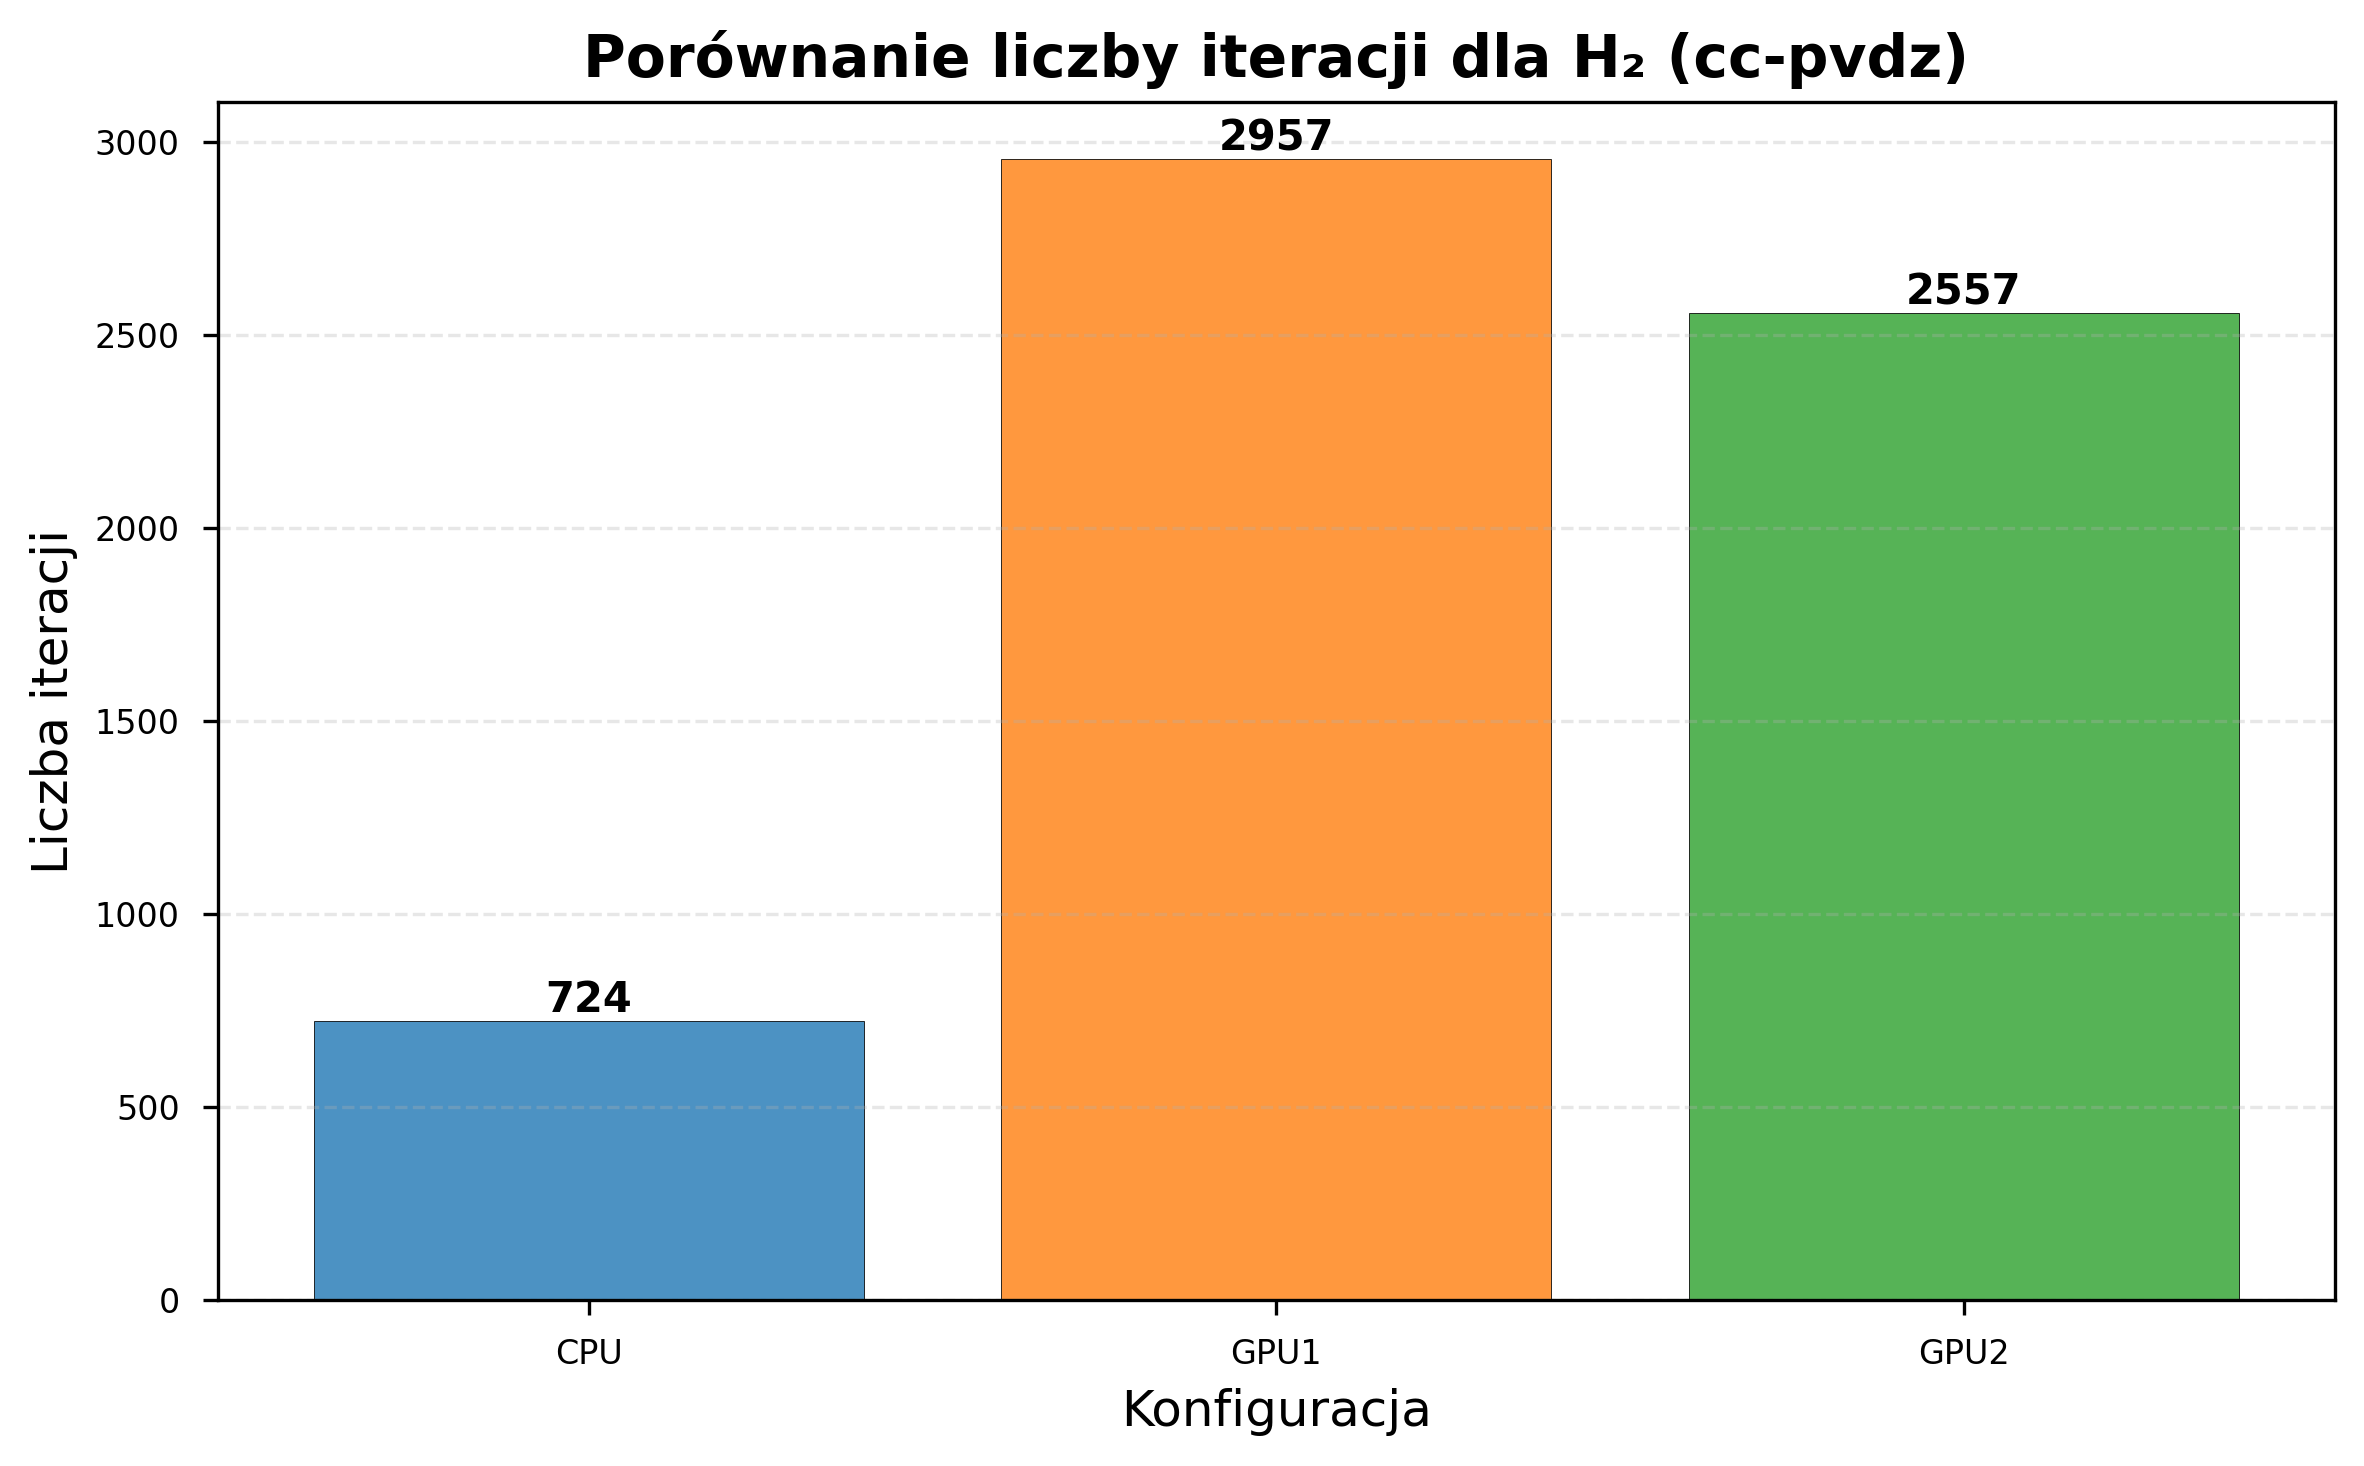
GPU acceleration scaled favorably with basis set complexity:
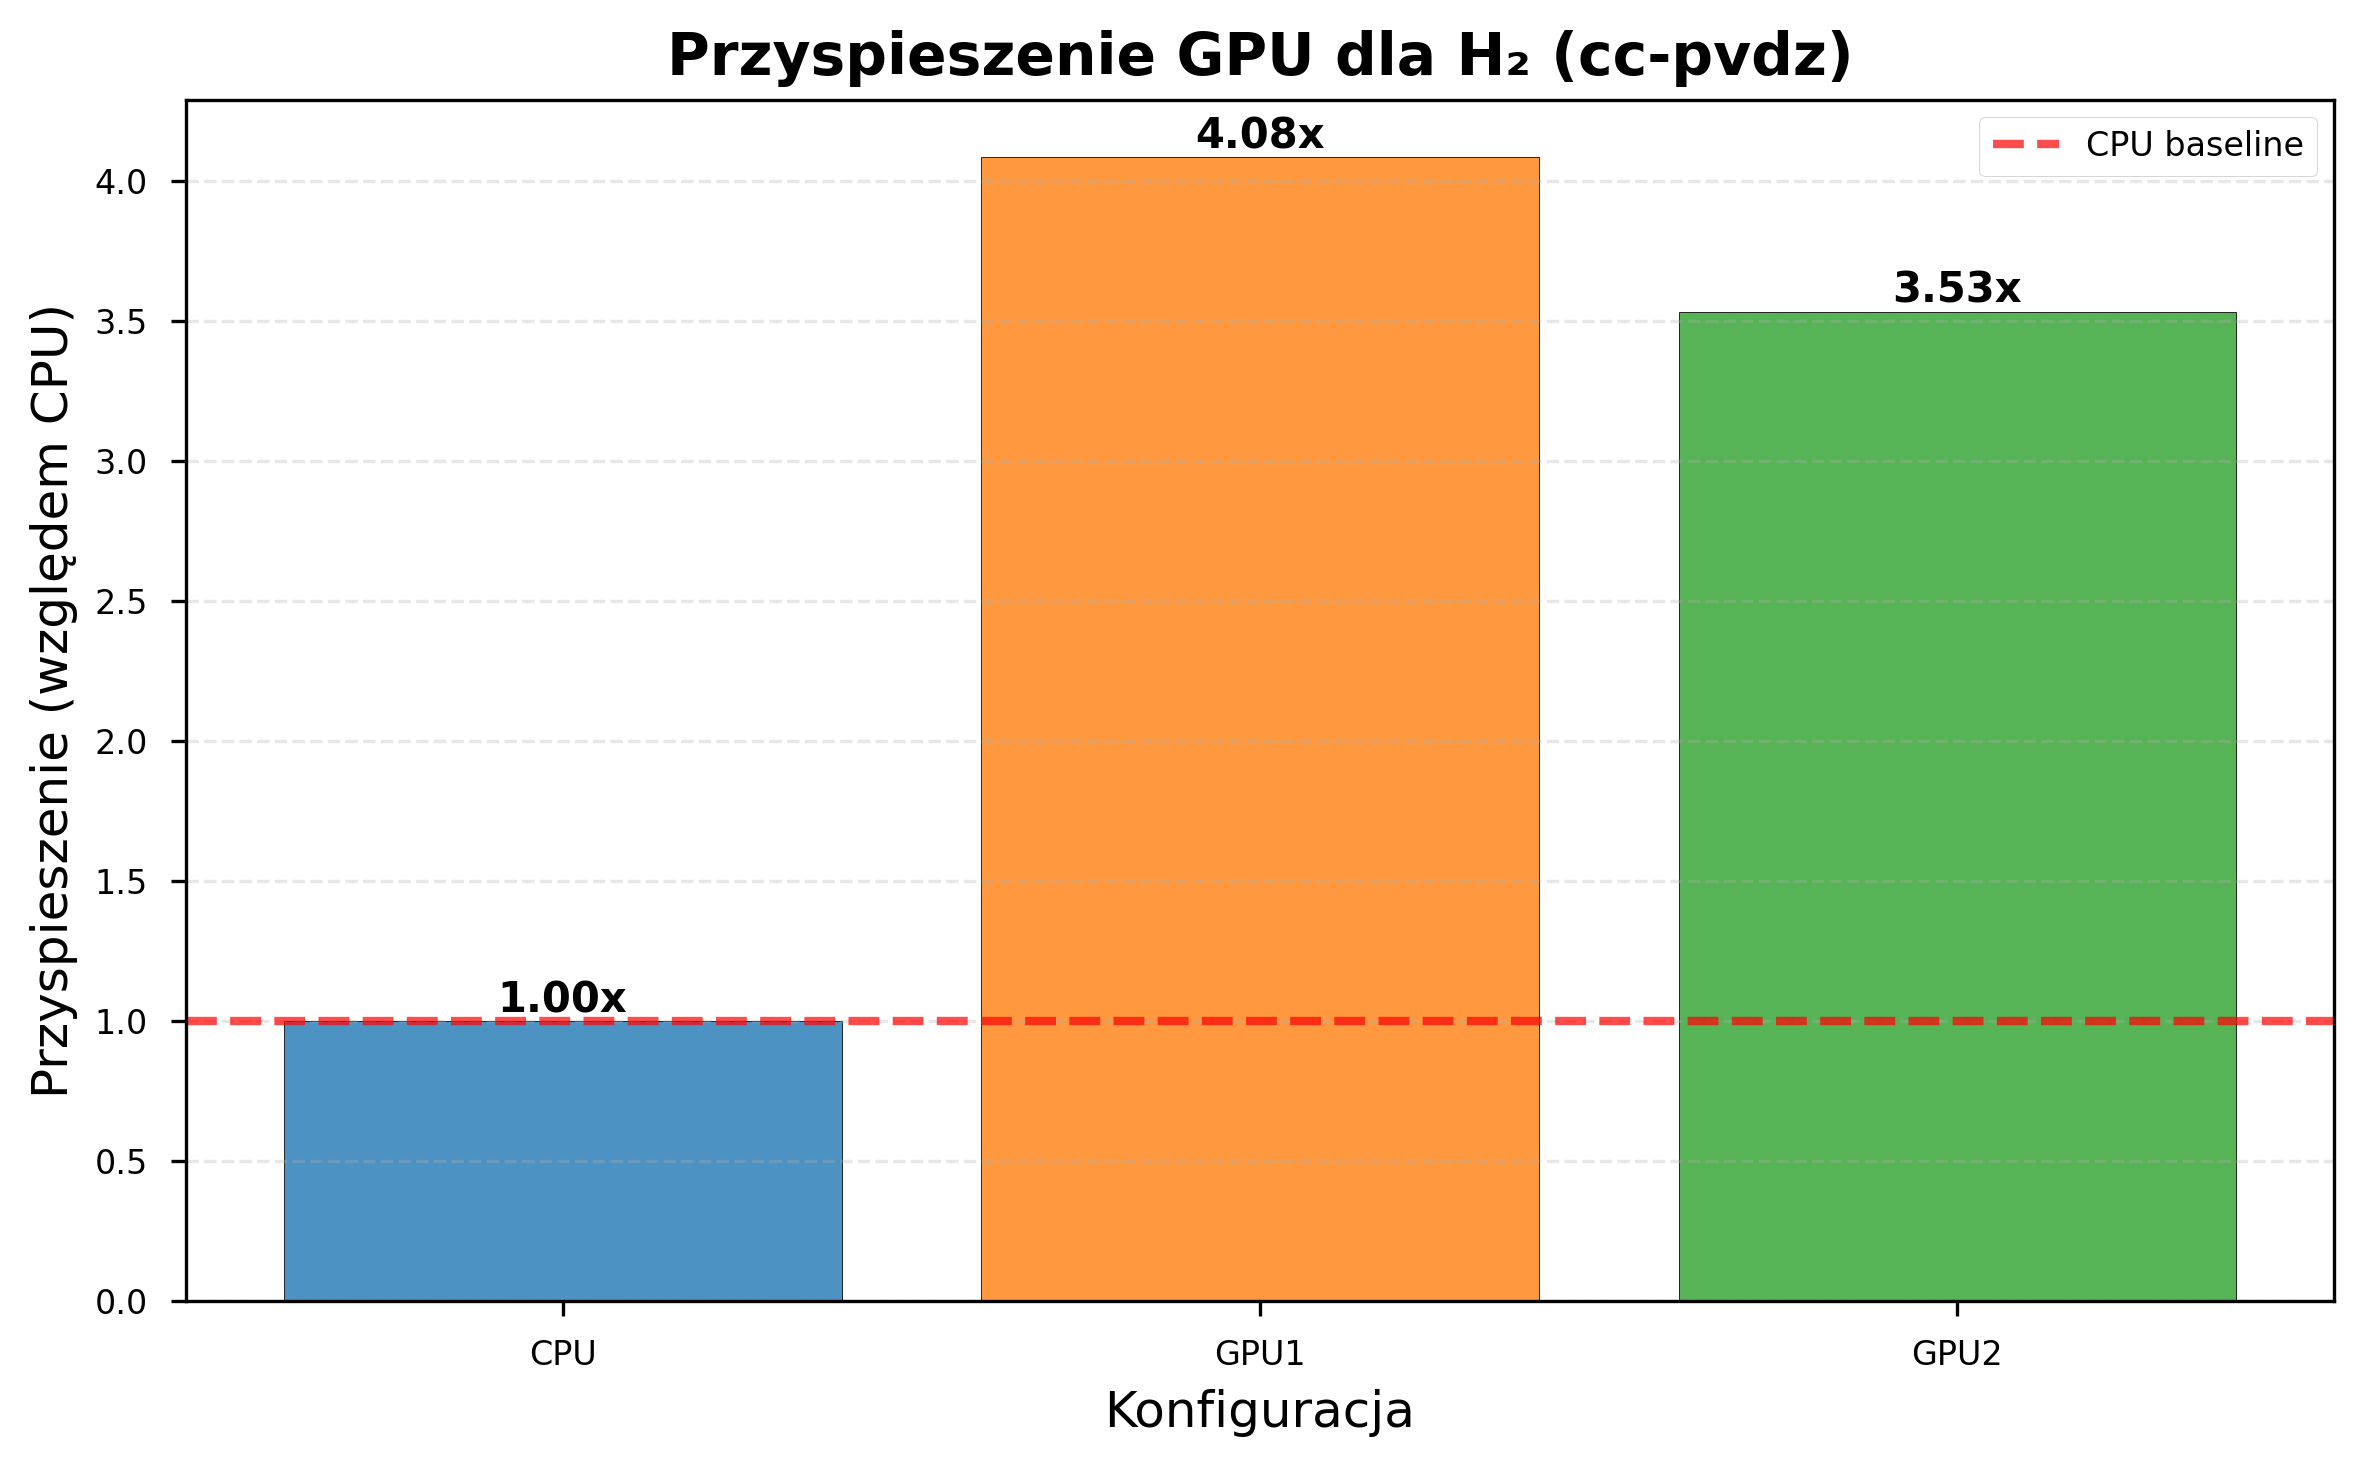
| Metric | STO-3G | cc-pVDZ |
|---|---|---|
| GPU1 speedup | 1.81x | 4.08x |
| GPU2 speedup | 1.74x | 3.53x |
| CPU iterations (same time) | 8,832 | 724 |
| GPU1 iterations (same time) | 12,057 | 2,957 |
| GPU2 iterations (same time) | 10,871 | 2,557 |
CC-pVDZ: Optimization Failure
Despite the significant speedup, the cc-pVDZ experiments revealed convergence difficulties inherent to larger basis sets:
- None of the configurations converged to the correct ground-state energy for H\(_2\) (expected approximately -1 Ha; observed approximately 24-26 Ha).
- Random parameter initialization proved inadequate for the expanded parameter space.
- Informed initialization strategies (e.g., Hartree-Fock starting points) were not tested but could potentially help with convergence in larger basis sets.
In short, larger basis sets increase accuracy potential but also make optimization harder. GPU acceleration reduces iteration time but does not solve the algorithmic convergence challenges.
Practical Notes on Basis Set Selection
Based on the thesis experiments:
- STO-3G was the only basis set tested across all six molecules. Iteration times of 2-4 seconds make it suitable for development and prototyping.
- cc-pVDZ was tested only on H\(_2\). CPU iteration times of ~206 seconds make GPU acceleration a practical necessity for this basis set.
- 6-31G is supported by the pipeline but was not benchmarked in the thesis.
- Initialization - Only random uniform initialization was tested. Alternative strategies (e.g., Hartree-Fock starting points) may improve convergence for larger basis sets but remain untested.
Detailed Error Analysis
Sources of Discrepancy
The relative errors between VQE results and literature values arise from several sources:
- Random parameter initialization: For larger molecules, the optimizer may converge to a local minimum far from the global optimum.
- Ansatz expressibility: The EfficientSU2 ansatz does not encode domain-specific molecular structure knowledge. Chemistry-inspired ansatze such as UCCSD were not tested but could potentially perform better at the cost of greater circuit depth.
- Barren plateaus: For higher qubit counts, gradient magnitudes can vanish exponentially, impeding gradient-based optimizers like L-BFGS-B (McClean et al. 2018).
- Basis set truncation: STO-3G is a minimal basis set, though both VQE and reference values use the same basis, so optimization quality is the primary source of discrepancy.
Error Distribution by Molecular Complexity
Measured relative errors by molecular complexity:
| Complexity Class | Molecules | Qubit Range | Relative Error Range |
|---|---|---|---|
| Simple | H\(_2\) | 4 | 4.2% |
| Simple | HeH\(^+\) | 4 | 24.7% |
| Moderate | LiH | 8 | 23.2% |
| Complex | BeH\(_2\) | 10 | 14.3% |
| Complex | H\(_2\)O | 12 | 20.8% |
| Complex | NH\(_3\) | 12 | 9.2% |
Error does not scale monotonically with qubit count (e.g., NH\(_3\) at 9.2% vs. H\(_2\)O at 20.8%, both 12 qubits). The thesis did not investigate the per-molecule differences in detail.
Reproducibility and Statistical Analysis
Run-to-Run Variability
Several molecules (H\(_2\), HeH\(^+\), LiH) were processed multiple times across different hardware configurations, enabling assessment of result reproducibility.
Timing stability. Iteration times exhibited run-to-run variations of \(\pm\)5-10%, attributable to system-level factors such as operating system scheduling, memory cache effects, and Docker container overhead. This level of variability is consistent with expectations for containerized workloads and does not compromise the validity of the performance comparisons.
Energy variability. Final energy values varied between runs of the same molecule due to the stochastic nature of random parameter initialization. Each run begins from a different point in parameter space and may converge to a different local minimum. This variability is an intrinsic property of the VQE algorithm under random initialization and is not attributable to hardware or software instability.
Statistical Significance of GPU Speedup
The GPU speedup measurements are based on averaged iteration times across multiple molecules and runs. The consistency of the speedup factor across different molecular systems (standard deviation <0.2x for both GPUs) provides confidence that the reported acceleration is robust and not an artifact of specific molecular configurations.
What the Experiments Showed
What worked:
- GPU acceleration: 1.74-1.81x speedup for STO-3G, 3.53-4.08x for cc-pVDZ, with no degradation of numerical accuracy.
- Scaling: GPU benefit increases with qubit count and basis set size.
- More iterations completed: GPU configurations completed up to 36% more iterations in the same time budget.
What didn't work:
- Energy accuracy: 4-25% errors relative to reference values across all molecules.
- cc-pVDZ optimization: The optimizer failed entirely on H\(_2\) with cc-pVDZ (24-26 Ha vs expected -1 Ha).
- Random initialization: Inadequate for larger systems and advanced basis sets — the primary driver of poor energy results.
Limitations and Future Work
Current Limitations
The benchmarking results presented here are subject to several limitations that should be considered when interpreting the findings:
-
Single optimizer tested. All experiments used the L-BFGS-B optimizer exclusively and COBYLA was used during development. While the pipeline supports 16 optimizers (including COBYLA, SPSA, Nelder-Mead, SLSQP, and others via
SUPPORTED_OPTIMIZERS), systematic benchmarking across optimizers has not yet been conducted. Different optimizers may exhibit different scaling characteristics with respect to GPU acceleration and molecular complexity. -
Random initialization only. The use of uniform random initialization over \([0, 2\pi)\) is the primary driver of the 9-25% relative errors observed for medium and large molecules (see Energy Results and Detailed Error Analysis). Hartree-Fock-informed initialization would provide a physically motivated starting point near the ground state but was not employed in these experiments.
-
Consumer-grade Pascal-era GPUs. The GTX 1060 and GTX 1050 Ti are Pascal-architecture GPUs from 2016 with limited CUDA core counts and VRAM (4-6 GB). These GPUs lack native support for NVIDIA's cuQuantum library, which requires Ampere or newer architectures. Professional-grade GPUs (e.g., NVIDIA A100, H100) would be expected to provide substantially greater speedups, particularly for larger molecular systems.
-
Limited cc-pVDZ data. The cc-pVDZ experiments were conducted only for H\(_2\) due to computational constraints. Extending these experiments to larger molecules would provide more comprehensive basis set scaling data.
-
Simulator-only results. All experiments were conducted using statevector simulation. Results on real quantum hardware would be subject to additional factors including gate noise, measurement error, and decoherence.
Planned Extensions
The following extensions are informed by the thesis discussion (Chapter 6) and address the identified limitations directly.
Algorithmic improvements:
- Hartree-Fock-informed initialization - using the classical HF solution as a starting point to reduce local minima entrapment and improve convergence quality across all molecules.
- Adaptive ansatze (ADAPT-VQE) - dynamically growing the circuit to reduce barren plateau effects and avoid unphysical states (Grimsley et al. 2019).
- Systematic multi-optimizer benchmarking - leveraging the existing 16-optimizer support to characterize optimizer-molecule-hardware interactions.
Hardware and platform modernization:
- Modern GPU hardware - benchmarking on Ampere/Ada-architecture GPUs (RTX 3000/4000 series, A100, H100) with native cuQuantum support, expected to yield an additional 30-50% speedup from improved tensor units and memory bandwidth.
- Cloud quantum platform integration - extending backend support to Amazon Braket and Azure Quantum alongside the existing IBM Quantum integration, enabling real-device validation on NISQ hardware.
Extended experimentation:
- Basis set studies - extending 6-31G and cc-pVDZ experiments to all six molecules to establish comprehensive basis set scaling data.
- ML-based optimization - using the accumulated iteration data (31,760 STO-3G iterations, 6,238 cc-pVDZ iterations) to train models for optimization trajectory prediction, automatic optimizer selection, and fast surrogate energy estimators.
Infrastructure:
- Kubernetes orchestration - migrating from Docker Compose to Kubernetes for improved scaling and resource management in production environments.
- Parallel multi-molecule processing - simultaneous processing of multiple molecular systems with automatic load balancing across available hardware.
Summary
The clear positive result: GPU acceleration delivers consistent speedups — 1.74-1.81x for STO-3G, 3.53-4.08x for cc-pVDZ — and scales favorably with problem complexity. GPU configurations complete up to 36% more iterations in the same time budget.
The clear problem: The VQE experiments did not reach meaningful ground-state energies for most molecules. H\(_2\) achieved 4.2% error relative to the Hartree-Fock reference; larger molecules exhibited 9-25% errors; cc-pVDZ experiments failed entirely. Random initialization with EfficientSU2 is the primary cause, and addressing it is the focus of future work.