Performance Metrics
The Quantum Pipeline collects a comprehensive set of metrics during VQE simulation execution. These metrics are organized into three categories: system metrics, VQE execution metrics, and scientific accuracy metrics.
Metric Categories
System Metrics
System metrics track hardware resource utilization for each simulation container. These are collected by a background monitoring thread and pushed to the Prometheus PushGateway at regular intervals. System metrics are exported by the background monitoring thread in performance_monitor.py.
| Metric | Prometheus Name | Type | Unit | Description |
|---|---|---|---|---|
| CPU Usage | quantum_system_cpu_percent |
Gauge | % | Current CPU utilization percentage |
| Memory Usage | quantum_system_memory_percent |
Gauge | % | Current memory utilization percentage |
| Memory Used | quantum_system_memory_used_bytes |
Gauge | bytes | Current memory consumption in bytes |
| CPU Load (1m) | quantum_system_cpu_load_1m |
Gauge | load | 1-minute load average |
| Container Uptime | quantum_system_uptime_seconds |
Gauge | seconds | Time since container start |
GPU Metrics
GPU acceleration is supported via the --gpu flag, but GPU-specific Prometheus metrics (e.g., GPU utilization, GPU memory) are not currently exported by the performance monitor. This
was a concious decision on the design part. In most of the cases - GPU usage very much varies from second to second. It made statistics very much unreliable. In the thesis monitoring
it was replaced with nvidia_gpu_exporter,
which was reliable, due to relying on nvidia-smi.
VQE Execution Metrics
VQE execution metrics are exported after each simulation completes. These include timing breakdowns, result values, and derived efficiency metrics. All VQE metrics are pushed to the PushGateway by performance_monitor.py.
| Metric | Prometheus Name | Type | Description |
|---|---|---|---|
| Total Execution Time | quantum_vqe_total_time |
Gauge | End-to-end simulation time |
| Hamiltonian Build Time | quantum_vqe_hamiltonian_time |
Gauge | Time to construct the molecular Hamiltonian |
| Qubit Mapping Time | quantum_vqe_mapping_time |
Gauge | Time for fermionic-to-qubit operator mapping |
| VQE Optimization Time | quantum_vqe_vqe_time |
Gauge | Time spent in VQE optimization loop |
| Minimum Energy | quantum_vqe_minimum_energy |
Gauge | Best energy found during optimization (Hartree) |
| Iterations Count | quantum_vqe_iterations_count |
Gauge | Total optimizer iterations to convergence |
| Optimal Parameters | quantum_vqe_optimal_parameters_count |
Gauge | Number of optimized variational parameters |
Scientific Accuracy Metrics
Experimental Feature
Scientific accuracy tracking is still in testing. Most of the thesis research was conducted without it. The reference values used by the project are drawn from an already scarce bibliography that the author managed to gather - they should be treated as best-effort baselines rather than authoritative benchmarks.
Scientific metrics evaluate the quality of VQE results against known reference values. These metrics are critical for assessing whether simulations achieve chemical accuracy. Accuracy calculations are implemented in scientific_references.py.
| Dashboard Metric | Prometheus Name | Type | Description |
|---|---|---|---|
| Ground State Energy | quantum_experiment_minimum_energy |
Gauge | Minimum energy from optimization |
| Energy Error | quantum_vqe_energy_error_millihartree |
Gauge | Deviation from reference value in mHa |
| Chemical Accuracy | quantum_vqe_within_chemical_accuracy |
Gauge | Binary indicator (1 = within 1 mHa) |
| Accuracy Score | quantum_vqe_accuracy_score |
Gauge | Normalized accuracy score (0 to 100) |
Prometheus Metric Names
Complete Metric Reference
All metrics exported by the Quantum Pipeline use consistent naming conventions and label sets.
Labels
Every metric includes the following labels where applicable:
| Label | Description | Example Values |
|---|---|---|
container_type |
Identifies the simulation container configuration | cpu, gpu1, gpu2 |
molecule_symbols |
Chemical formula of the molecule being simulated | H2, LiH, BeH2, H2O, NH3 |
optimizer |
Optimization algorithm used | L-BFGS-B, COBYLA, SLSQP |
basis_set |
Basis set for the simulation | sto-3g, cc-pvdz |
molecule_id |
Unique identifier for the molecule instance | 0, 1, 2 |
backend_type |
Quantum simulation backend | aer_simulator, statevector |
Full Metric List
# System Resource Metrics
quantum_system_cpu_percent{container_type}
quantum_system_memory_percent{container_type}
quantum_system_uptime_seconds{container_type}

# VQE Performance Metrics
quantum_vqe_total_time{container_type, molecule_id, molecule_symbols, optimizer, backend_type}
quantum_vqe_vqe_time{container_type, molecule_id, molecule_symbols, optimizer, backend_type}
quantum_vqe_hamiltonian_time{container_type, molecule_id, molecule_symbols, optimizer, backend_type}
quantum_vqe_mapping_time{container_type, molecule_id, molecule_symbols, optimizer, backend_type}
quantum_vqe_iterations_count{container_type, molecule_id, molecule_symbols, optimizer, backend_type}
quantum_vqe_minimum_energy{container_type, molecule_id, molecule_symbols, optimizer, backend_type}
quantum_vqe_optimal_parameters_count{container_type, molecule_id, molecule_symbols, optimizer, backend_type}

# Scientific Accuracy Metrics
quantum_experiment_minimum_energy{container_type}
quantum_experiment_iterations_count{container_type}
quantum_vqe_reference_energy{container_type, molecule_id, molecule_symbols, optimizer, backend_type}
quantum_vqe_energy_error_hartree{container_type, molecule_id, molecule_symbols, optimizer, backend_type}
quantum_vqe_energy_error_millihartree{container_type, molecule_id, molecule_symbols, optimizer, backend_type}
quantum_vqe_within_chemical_accuracy{container_type, molecule_id, molecule_symbols, optimizer, backend_type}
quantum_vqe_accuracy_score{container_type, molecule_id, molecule_symbols, optimizer, backend_type}

# Derived Efficiency Metrics (via PushGateway)
quantum_vqe_iterations_per_second{container_type, molecule_id, molecule_symbols, optimizer, backend_type}
quantum_vqe_time_per_iteration{container_type, molecule_id, molecule_symbols, optimizer, backend_type}
quantum_vqe_overhead_ratio{container_type, molecule_id, molecule_symbols, optimizer, backend_type}
quantum_vqe_efficiency{container_type, molecule_id, molecule_symbols, optimizer, backend_type}
quantum_vqe_setup_ratio{container_type, molecule_id, molecule_symbols, optimizer, backend_type}
Collection Configuration
Collection Interval
The background monitoring thread collects system metrics at a configurable interval. Default values are defined in settings.py.
# Default collection interval: 10 seconds
--performance-interval 10

# Higher frequency for detailed analysis
--performance-interval 1

# Lower frequency to reduce overhead
--performance-interval 60
Export Formats
Metrics can be exported in multiple formats:
Metrics are pushed to the PushGateway in Prometheus exposition format. Scrape targets are configured in prometheus.yml.
PushGateway Hostname
The PushGateway hostname depends on the deployment configuration. The thesis deployment (docker-compose.thesis.yaml) uses monit as the service name, while prometheus.yml references prometheus-pushgateway. Adjust the --performance-pushgateway URL to match your compose file's service name or local instance.
Metrics are saved to a local JSON file after simulation completion:
Environment Variables
The PushGateway URL can also be set via environment variable:
Querying Metrics
PromQL Examples
The following PromQL queries demonstrate common monitoring tasks. These can be used in Grafana panels or directly in the Prometheus UI.
Average Iteration Time by Container Type
VQE Performance (Iterations per Second)
quantum_vqe_iterations_count{container_type=~"$container_type"}
    / quantum_vqe_total_time{container_type=~"$container_type"}
VQE Efficiency Ratio
Ratio of VQE optimization time to total execution time, indicating how much time is spent on actual computation versus overhead:
quantum_vqe_vqe_time{container_type=~"$container_type"}
    / quantum_vqe_total_time{container_type=~"$container_type"}
Overhead Ratio
Ratio of setup time (Hamiltonian construction plus qubit mapping) to VQE execution time:
(
    quantum_vqe_hamiltonian_time{container_type=~"$container_type"}
    + quantum_vqe_mapping_time{container_type=~"$container_type"}
)
    / quantum_vqe_vqe_time{container_type=~"$container_type"}
Energy Error Threshold Alert
Identify simulations that exceed the chemical accuracy threshold:
Container Resource Saturation
Detect containers approaching resource limits:
quantum_system_cpu_percent{container_type=~".*"} > 90
quantum_system_memory_percent{container_type=~".*"} > 85
Active Container Count
Performance Baselines
Experimental Setup
The baselines below were collected from a specific thesis experimental setup and are not general benchmarks. Results will vary depending on hardware, system load, and molecule complexity.
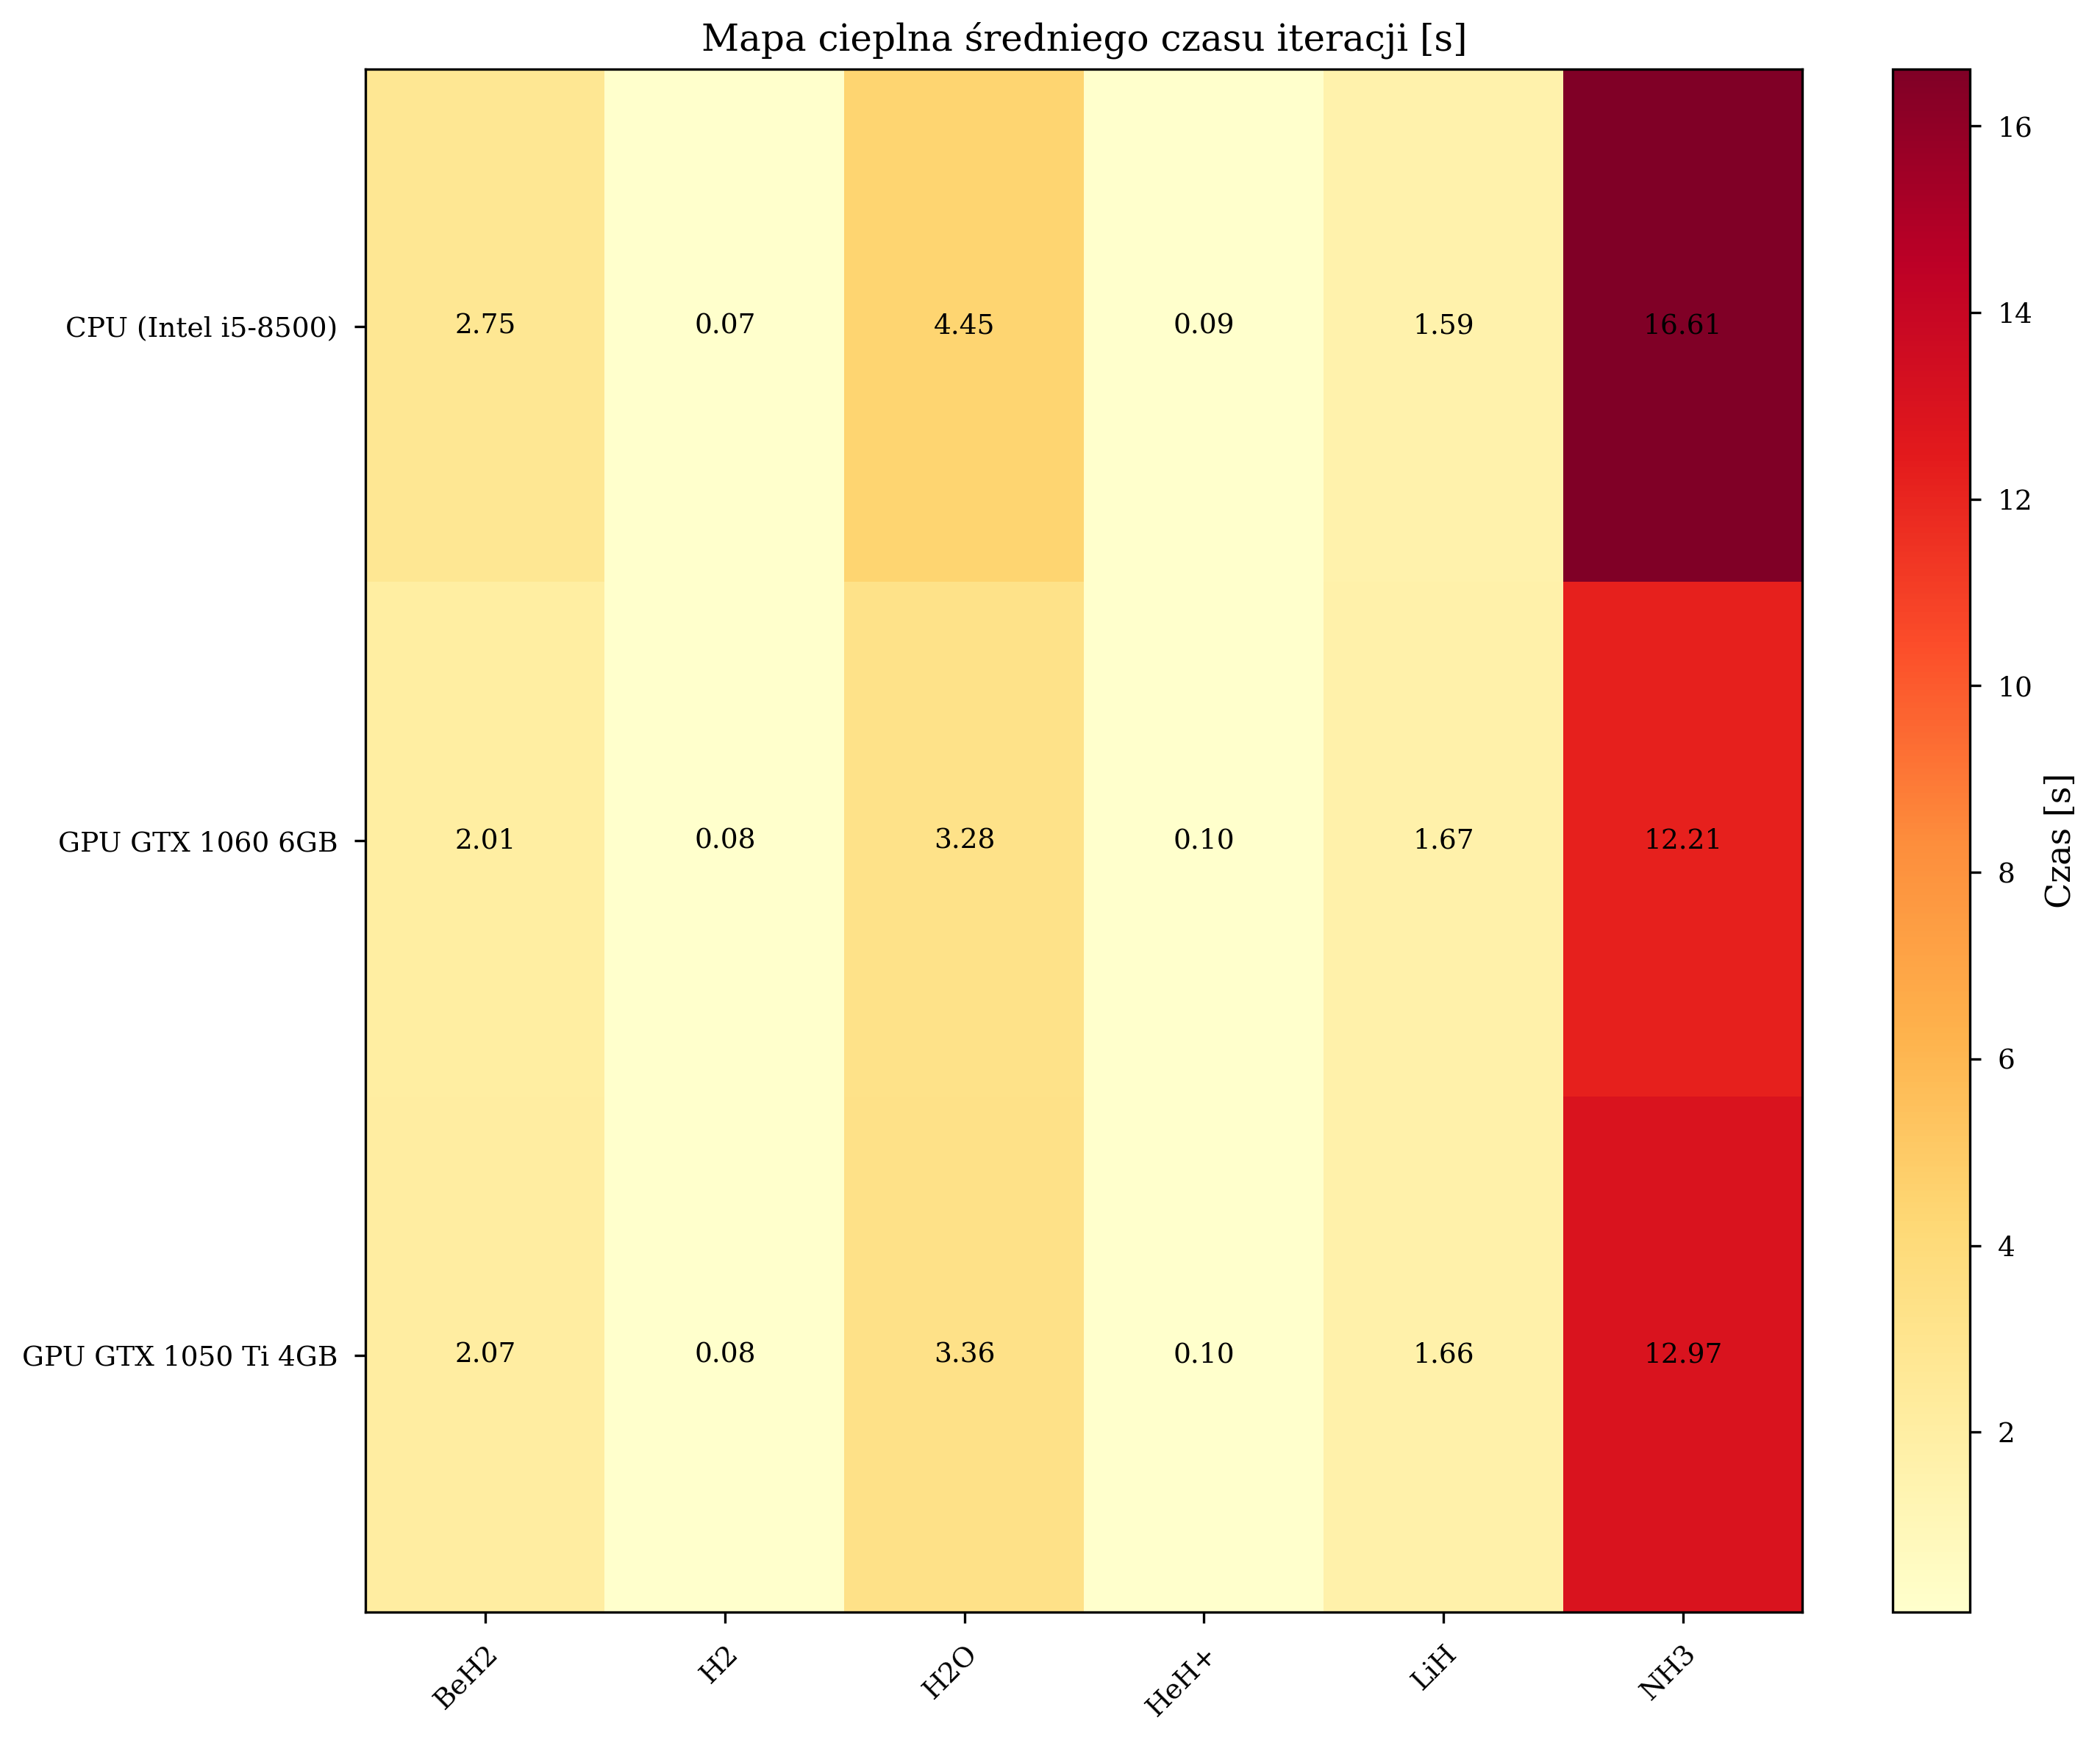
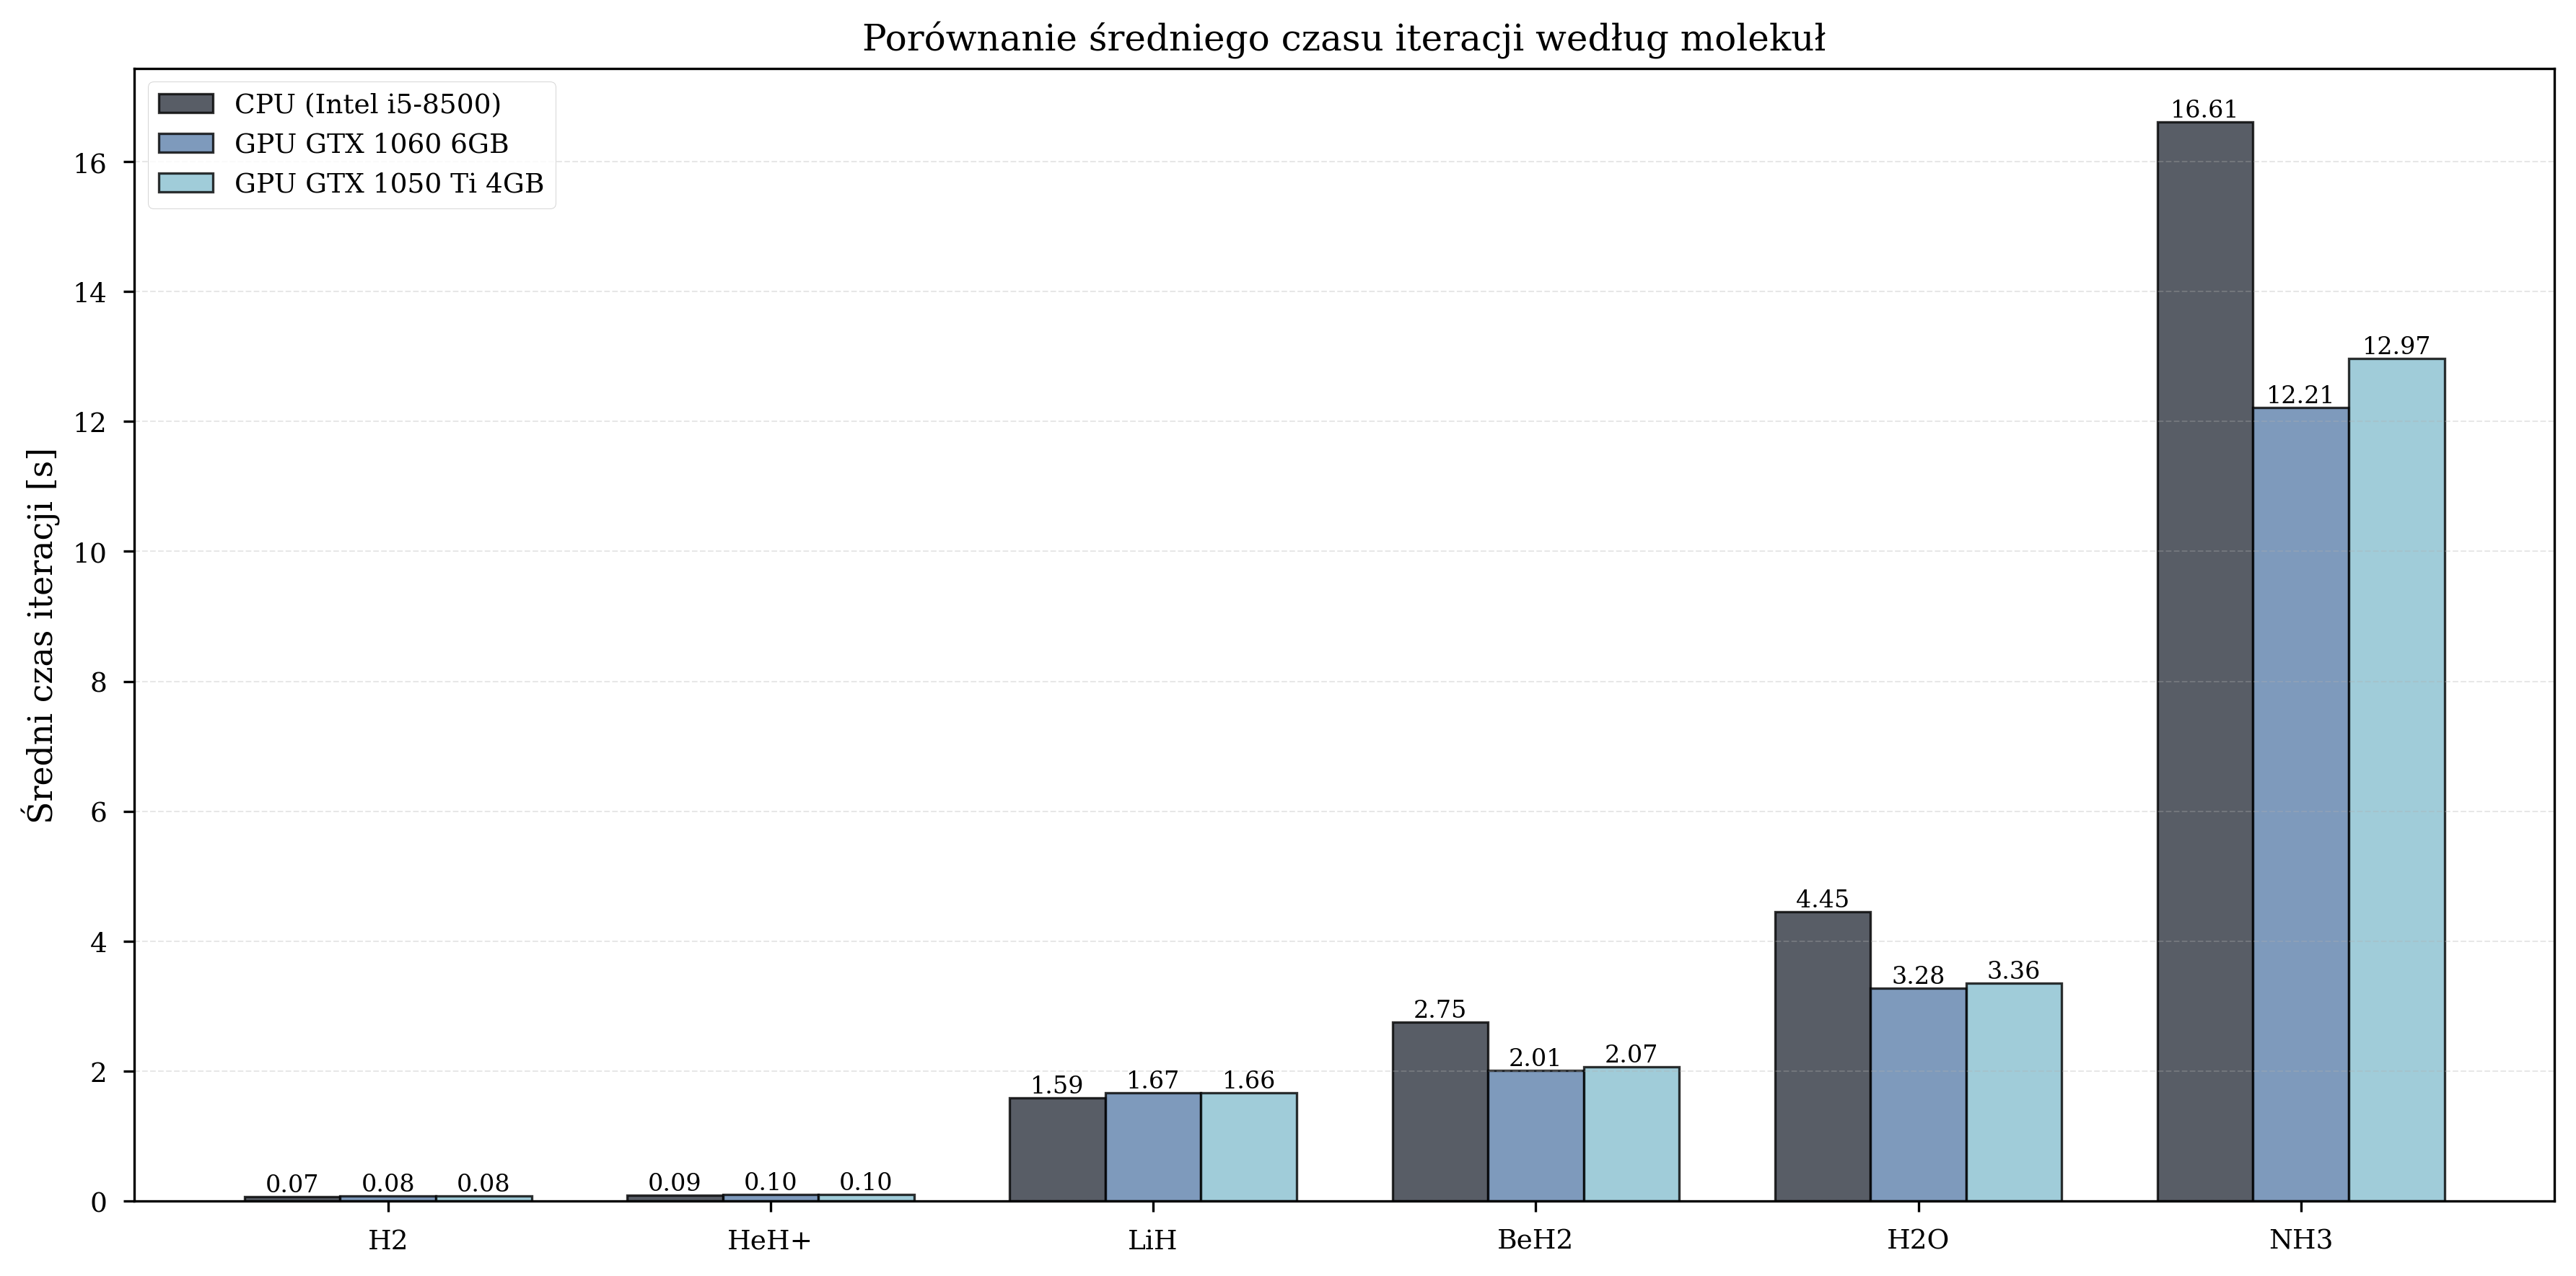
Based on experimental results with the sto-3g basis set and L-BFGS-B optimizer, the following performance baselines have been established:
| Configuration | Avg Time per Iteration | Speedup | Total Iterations |
|---|---|---|---|
| CPU (Intel i5-8500) | 4.259 s | 1.00x (baseline) | 8,832 |
| GPU (GTX 1060 6GB) | 2.357 s | 1.81x | 12,057 |
| GPU (GTX 1050 Ti 4GB) | 2.454 s | 1.74x | 10,871 |
GPU acceleration provides the greatest benefit for molecules of medium complexity (8-10 qubits), with speedups reaching up to 2.1x for BeH2. For smaller molecules (4 qubits), GPU overhead can negate the computational advantage. For the more complex cc-pVDZ basis set, speedups of 4.08x (GTX 1060) and 3.53x (GTX 1050 Ti) have been observed.
For instructions on visualizing these metrics in Grafana, see Grafana Dashboards.