Benchmarking Results
Data provenance
The GPU speedup measurements, convergence plots, and energy results on this page come from the original engineering thesis experiments, conducted before version 1.4 of the pipeline. Since then, the project has gone through a significant rewrite toward v2.0.0: batched execution via Airflow DAGs, Hartree-Fock initialization, a new monitoring stack, Garage replacing MinIO, and other infrastructure changes. The VQE algorithm itself is unchanged (same Qiskit Aer statevector backend), so the GPU speedup numbers and convergence behavior remain valid. The v2.0.0 verification table (H2/HeH+ results) is from the current codebase. Infrastructure details from the thesis - MinIO, simpler Airflow DAGs, the old Grafana setup - no longer reflect the current deployment.
This page presents VQE benchmarking results from two sources: thesis experiments (v1.x, random initialization, L-BFGS-B only) and v2.0.0 verification runs (multiple optimizers, initialization strategies, and ansatz types). The thesis data covers GPU acceleration performance and energy results across six molecules. The v2.0.0 data demonstrates the impact of initialization strategy and optimizer choice.
Experimental Setup
Hardware Configurations (Thesis)
Three hardware configurations were used in the thesis experiments:
| Configuration | Processor / GPU | Memory |
|---|---|---|
| CPU Baseline | Intel Core i5-8500 (6 cores @ 3.00 GHz) | 16 GB RAM |
| GPU1 | NVIDIA GTX 1060 (1280 CUDA cores) | 6 GB VRAM |
| GPU2 | NVIDIA GTX 1050 Ti (768 CUDA cores) | 4 GB VRAM |
All configurations operated within a containerized Docker environment using the
nvidia/cuda:11.8.0-cudnn8-devel-ubuntu20.04 base image (since updated to CUDA 12.6 in the current
Dockerfile.gpu).
Simulation Parameters (Thesis)
The following parameters were held constant across all primary thesis experiments:
| Parameter | Value |
|---|---|
| Basis set | STO-3G |
| Optimizer | L-BFGS-B (gradient-based) |
| Convergence threshold (ftol, gtol) | \(10^{-6}\) |
| Simulation method | Statevector (CPU/GPU) |
| Ansatz | EfficientSU2 |
| Parameter initialization | Random uniform \([0, 2\pi]\) |
Only L-BFGS-B was tested in the thesis. The pipeline lists 16 optimizers, of which 8 are wired through the optimizer config factory (three with dedicated configuration classes: L-BFGS-B, COBYLA, SLSQP). Selecting one of the others raises an error. See Optimizers for details.
v2.0.0 Verification Parameters
The v2.0.0 verification runs tested broader combinations:
| Parameter | Values Tested |
|---|---|
| Basis sets | STO-3G, 6-31G |
| Optimizers | COBYLA, L-BFGS-B, SLSQP, Nelder-Mead, Powell, BFGS |
| Ansatze | EfficientSU2, RealAmplitudes, ExcitationPreserving |
| Initialization | Random, Hartree-Fock |
| Simulation | Aer statevector (CPU), seed 42 |
| Default reps | 2 (unless noted) |
Evaluation Metrics
The system was assessed on the following metrics:
- Iteration time - wall-clock time for a single VQE optimization iteration
- Total simulation time - elapsed time from initialization to convergence
- Iterations to convergence - number of optimizer iterations required
- Cost function value - final ground-state energy in Hartree (Ha)
- Energy error - difference between the VQE result and the PySCF Hartree-Fock reference energy, reported in both Hartree and millihartree
Molecules Tested
Thesis Molecules (STO-3G)
Six molecular systems of increasing complexity were tested in the thesis:
| Molecule | Formula | Qubits (STO-3G) | Electrons | Approx. Iterations | Complexity |
|---|---|---|---|---|---|
| Hydrogen | H\(_2\) | 4 | 2 | ~650 | Minimal |
| Helium hydride cation | HeH\(^+\) | 4 | 2 | ~630 | Minimal |
| Lithium hydride | LiH | 12 | 4 | ~1,455 | Moderate |
| Beryllium dihydride | BeH\(_2\) | 14 | 6 | ~2,373 | Significant |
| Water | H\(_2\)O | 14 | 10 | ~2,185 | High |
| Ammonia | NH\(_3\) | 16 | 10 | ~2,410 | High |
Pipeline-Supported Molecules
The pipeline ships with eight molecules spanning 4-30 qubits under STO-3G,
defined in
molecules.thesis.json:
H\(_2\), HeH\(^+\), LiH, BeH\(_2\), H\(_2\)O, N\(_2\), NH\(_3\), CO\(_2\)
Not all molecules have been benchmarked. The thesis experiments covered six of these: H\(_2\), HeH\(^+\), LiH, BeH\(_2\), H\(_2\)O, and NH\(_3\).
V2.0.0 Verification Results
The v2.0.0 refactoring was verified against a range of optimizer, basis set, initialization, and ansatz combinations. All runs used Aer statevector on CPU with seed 42 and EfficientSU2 (2 reps) unless noted.
| Optimizer | Basis | Init | Iters | H\(_2\) (Ha) | HeH\(^+\) (Ha) | Notes |
|---|---|---|---|---|---|---|
| COBYLA | sto-3g | random | 30 | -1.555 | -4.004 | Completed naturally |
| L-BFGS-B | sto-3g | random | 30 | -0.895 | -3.283 | Hard limit |
| SLSQP | sto-3g | random | 50 | -1.111 | -3.562 | RealAmplitudes 3r |
| Nelder-Mead | sto-3g | random | 50 | -0.553 | -3.200 | |
| Powell | sto-3g | random | 30 | -0.005 | -0.011 | ExcitationPreserving |
| COBYLA | sto-3g | random | 235/221 | -1.785 | -4.338 | Convergence 1e-4 |
| COBYLA | sto-3g | hf | 50 | -1.836 | -4.267 | |
| BFGS | sto-3g | hf | 40 | -1.838 | -4.224 | |
| L-BFGS-B | sto-3g | hf | 30 | -1.838 | -4.218 | |
| L-BFGS-B | 6-31g | random | 1029/1372 | +2.101 | -0.956 | H\(_2\) stuck in a poor local minimum |
| L-BFGS-B | 6-31g | hf | 50 | -1.857 | -4.294 | HF avoids local min |
These are electronic energies (before nuclear repulsion correction). The table is reproduced from the Changelog.
Key Observations
Initialization strategy is the dominant factor. The last two rows make this clear: L-BFGS-B with random init on 6-31G spent 1029 iterations to arrive at a positive energy for H\(_2\), a poor local minimum. The same setup with HF init reached -1.857 Ha in 50 iterations.
HF init consistently reaches lower energies. Across all three optimizers tested with HF init (COBYLA, BFGS, L-BFGS-B), H\(_2\) energies clustered around -1.836 to -1.838 Ha, compared to -0.553 to -1.555 Ha with random init.
Optimizer choice matters, but less than init strategy. Among random-init runs, COBYLA outperformed L-BFGS-B and Nelder-Mead. Among HF-init runs, all three optimizers produced similar results, suggesting that good initialization reduces sensitivity to optimizer choice.
Ansatz type affects results. The ExcitationPreserving run (Powell, random init) reached only -0.005 Ha for H\(_2\). This is likely due to the combination of a poorly suited optimizer (Powell) and limited iterations (30) rather than a fundamental ansatz limitation, but it has not been investigated further.
Thesis Optimization Behavior
Optimization Trajectories
Across all 24 thesis experimental runs (6 CPU, 9 GPU1, 9 GPU2), GPU acceleration did not change optimization trajectories - all hardware configurations produced the same energy results for the same random initialization seed. The optimizer terminated after hundreds to thousands of iterations, but in most cases did not reach the known ground-state energies.
Iteration counts before termination:
- Small molecules (H\(_2\), HeH\(^+\), 4 qubits): ~650 iterations (H\(_2\)) and ~630 iterations (HeH\(^+\)).
- Medium molecules (LiH, 12 qubits): ~1,455 iterations on average.
- Large molecules (BeH\(_2\), H\(_2\)O, NH\(_3\), 14-16 qubits): 1,500-2,700 iterations before termination.
Molecule-Specific Trajectories
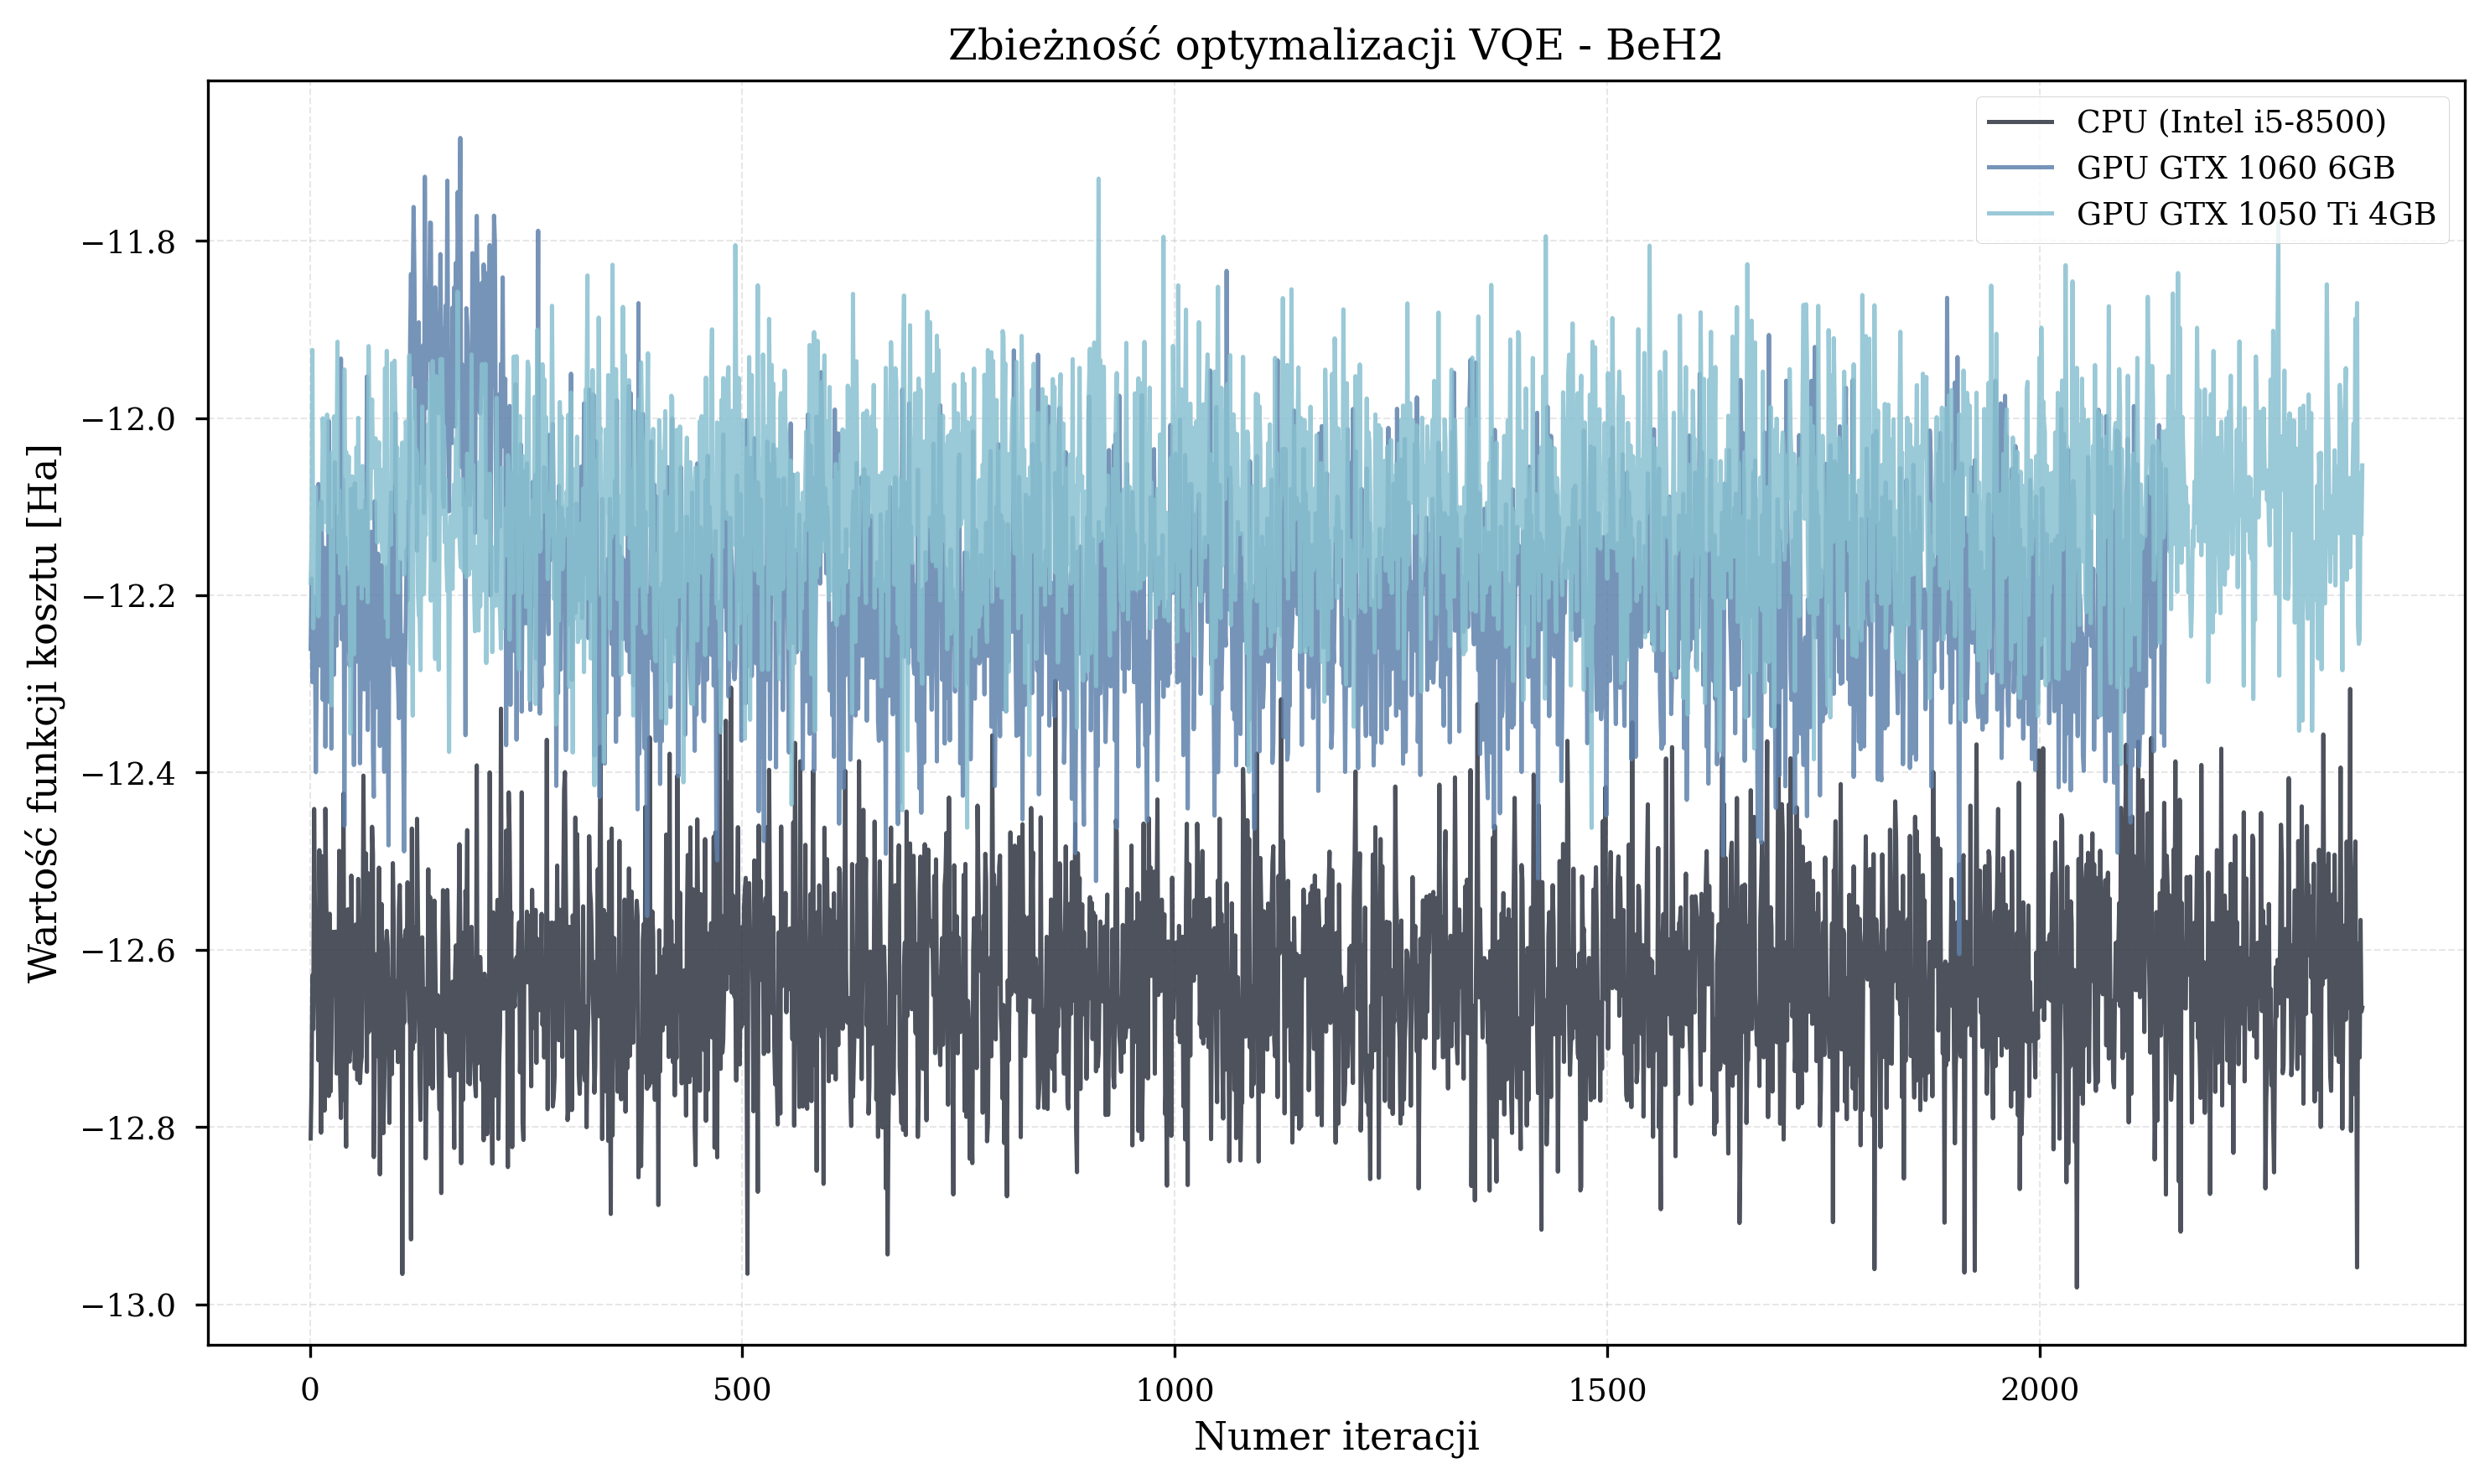
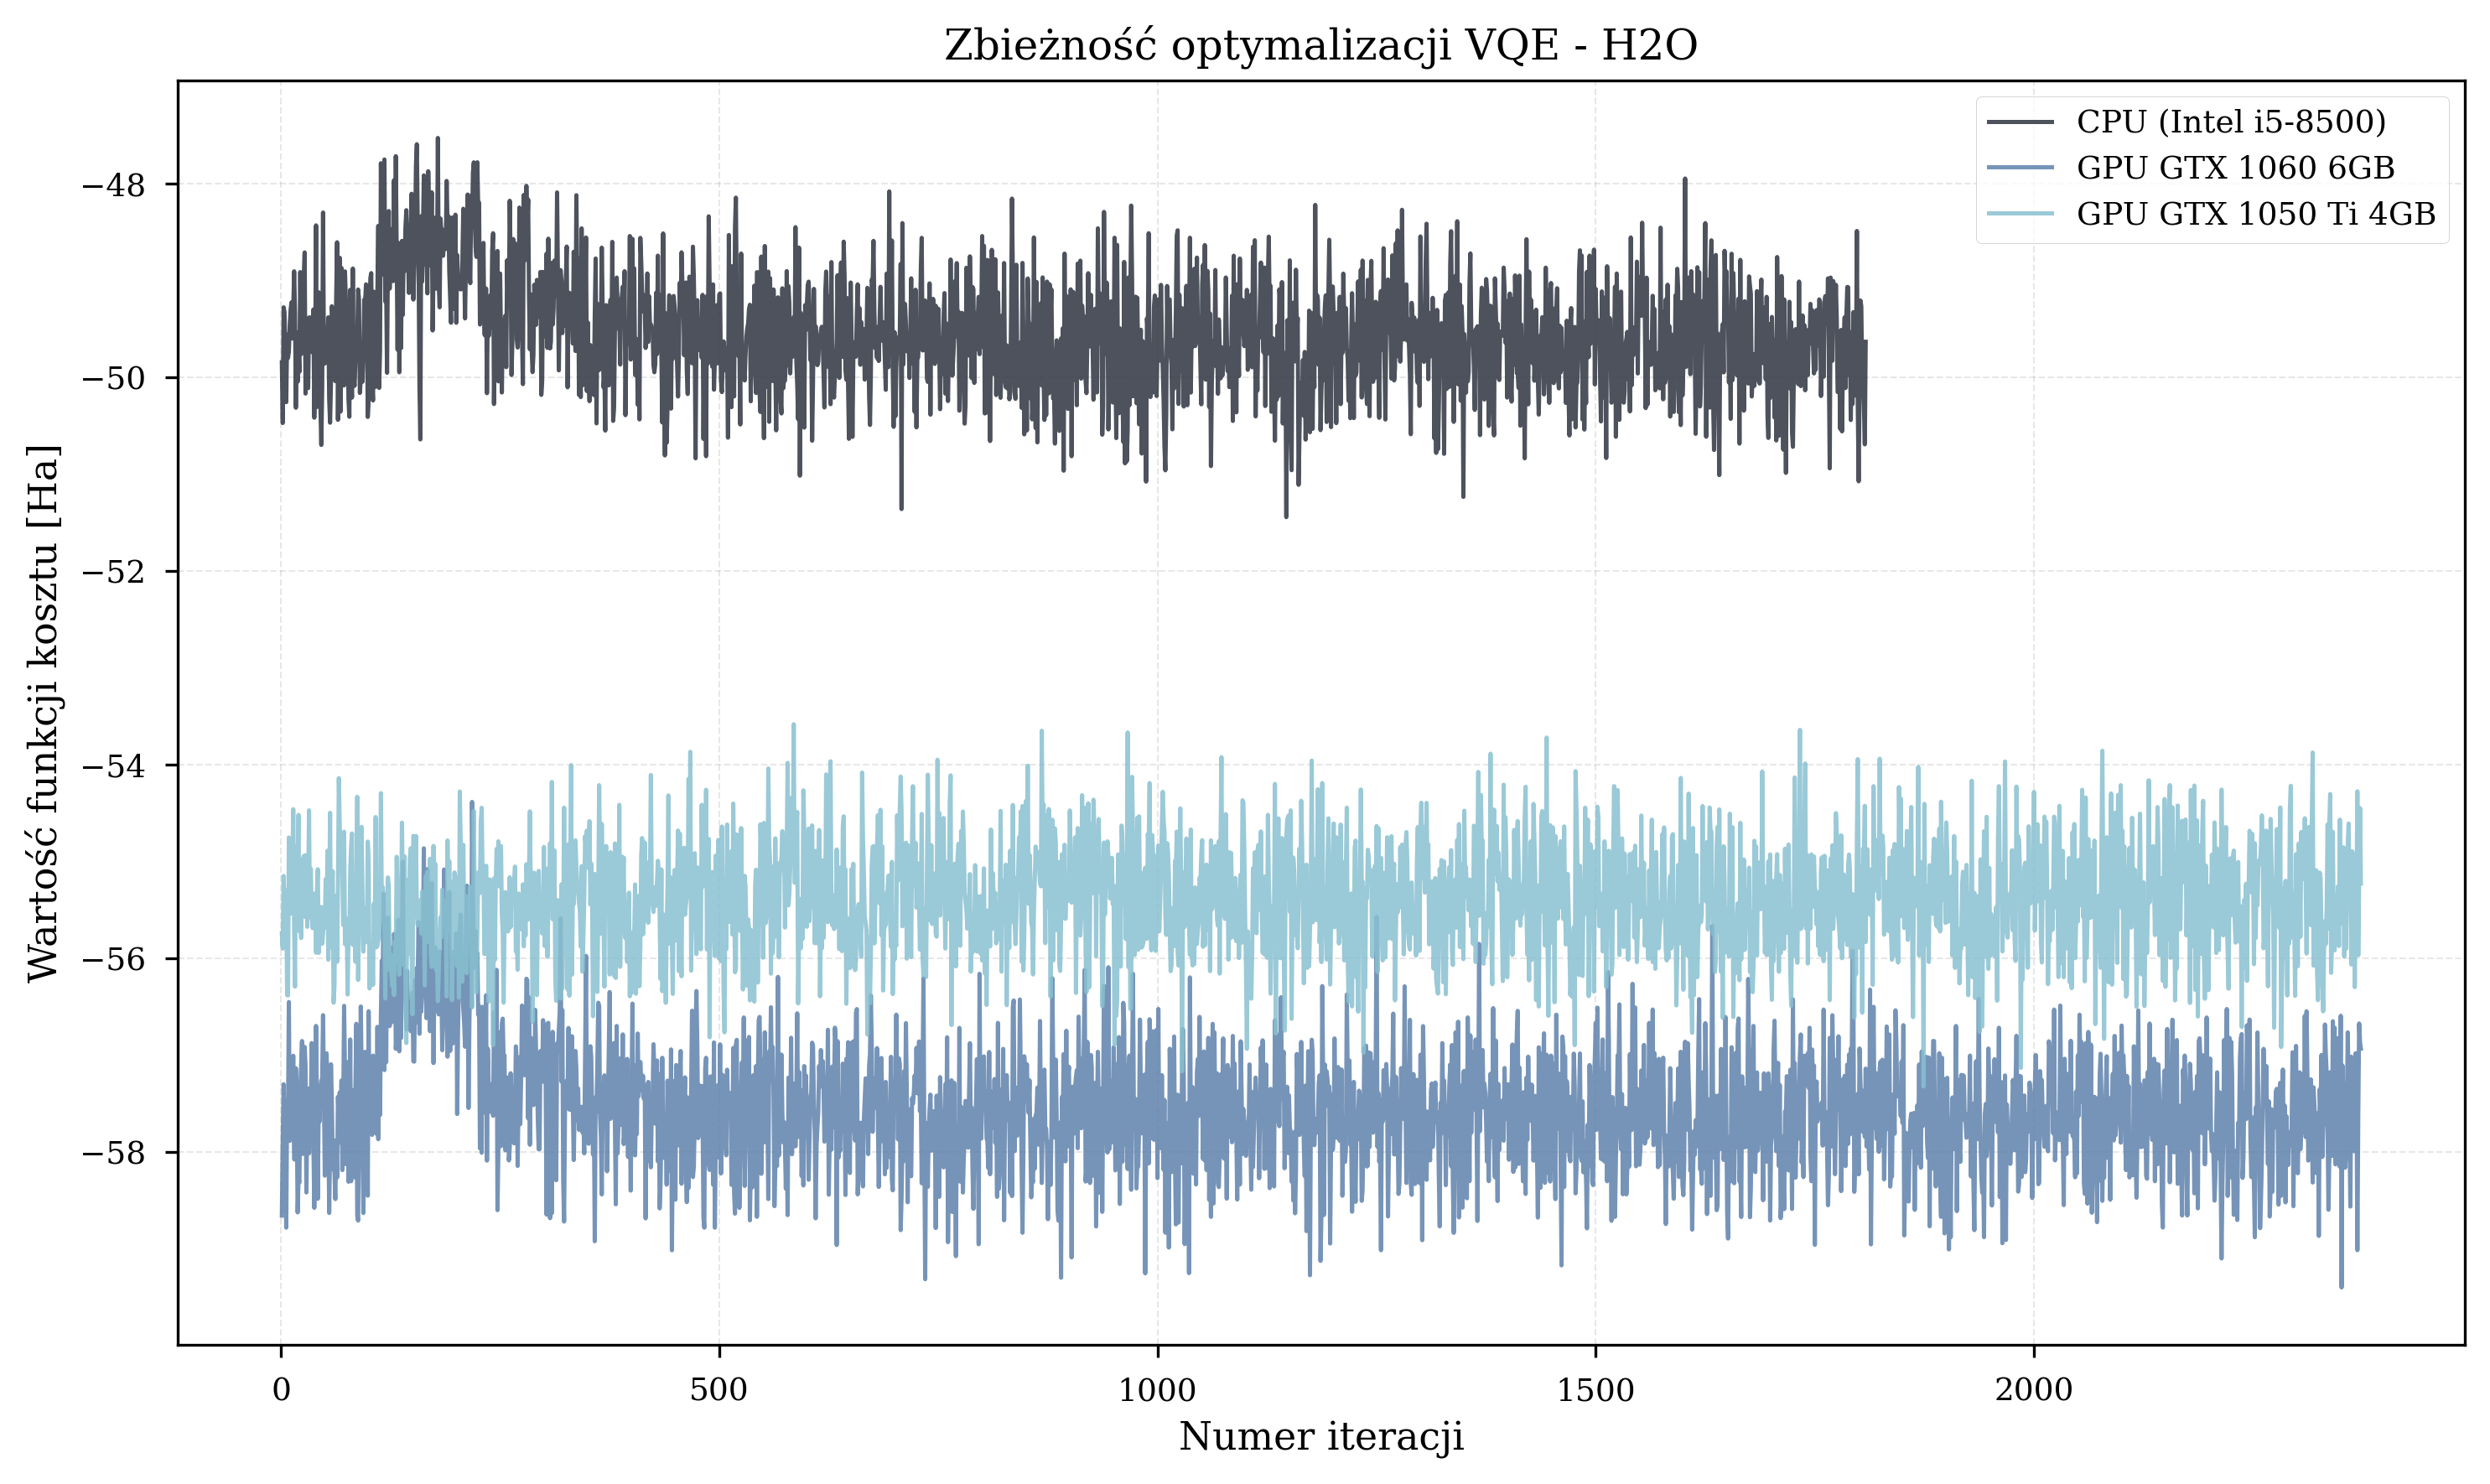
Thesis Energy Results
The final energy values achieved by each configuration provide insight into optimization quality. Due to the random initialization, these graphs are fundamentally flawed and do not reflect the quality of convergence.
If there is anything to take from these, it is that faster hardware completes more iterations in the same wall-clock time. Under random parameter initialization, more iterations mean a better statistical chance of reaching lower energy values.
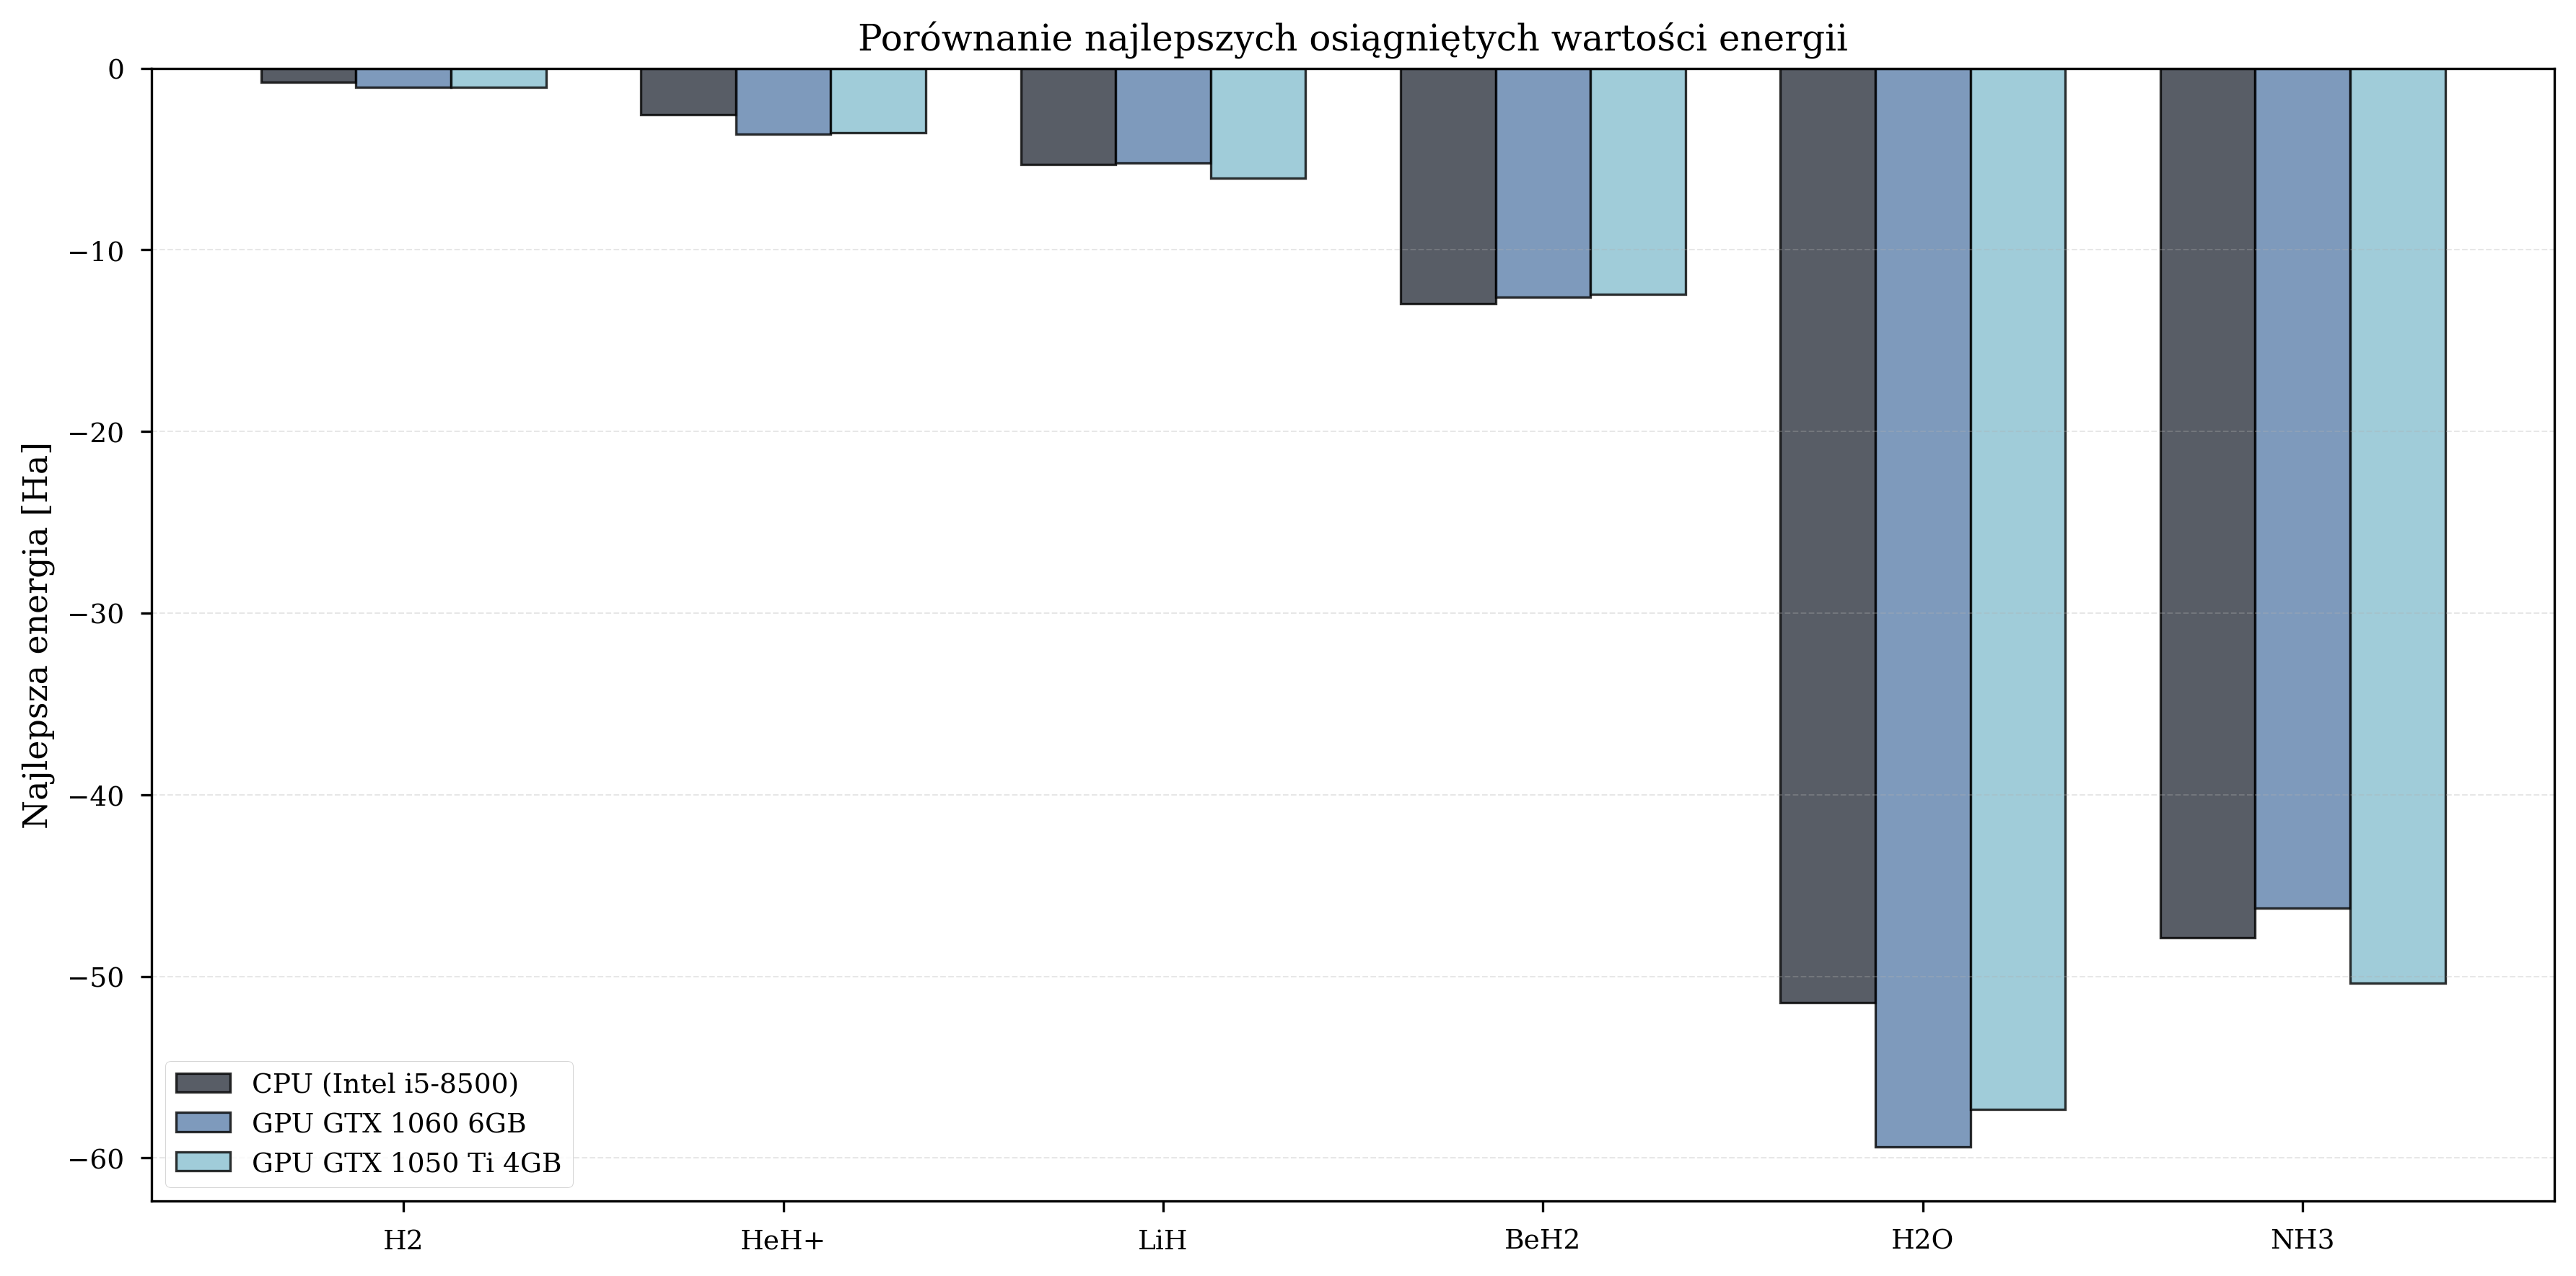
Best Achieved Energies (Ha) - Thesis, Random Init
| Molecule | CPU | GPU GTX 1060 | GPU GTX 1050 Ti |
|---|---|---|---|
| H\(_2\) | -0.79 | -1.05 | -1.07 |
| LiH | -5.32 | -5.23 | -6.05 |
| BeH\(_2\) | -12.98 | -12.60 | -12.46 |
| H\(_2\)O | -51.44 | -59.40 | -57.32 |
| NH\(_3\) | -47.88 | -46.26 | -50.36 |
CPU vs. GPU Performance
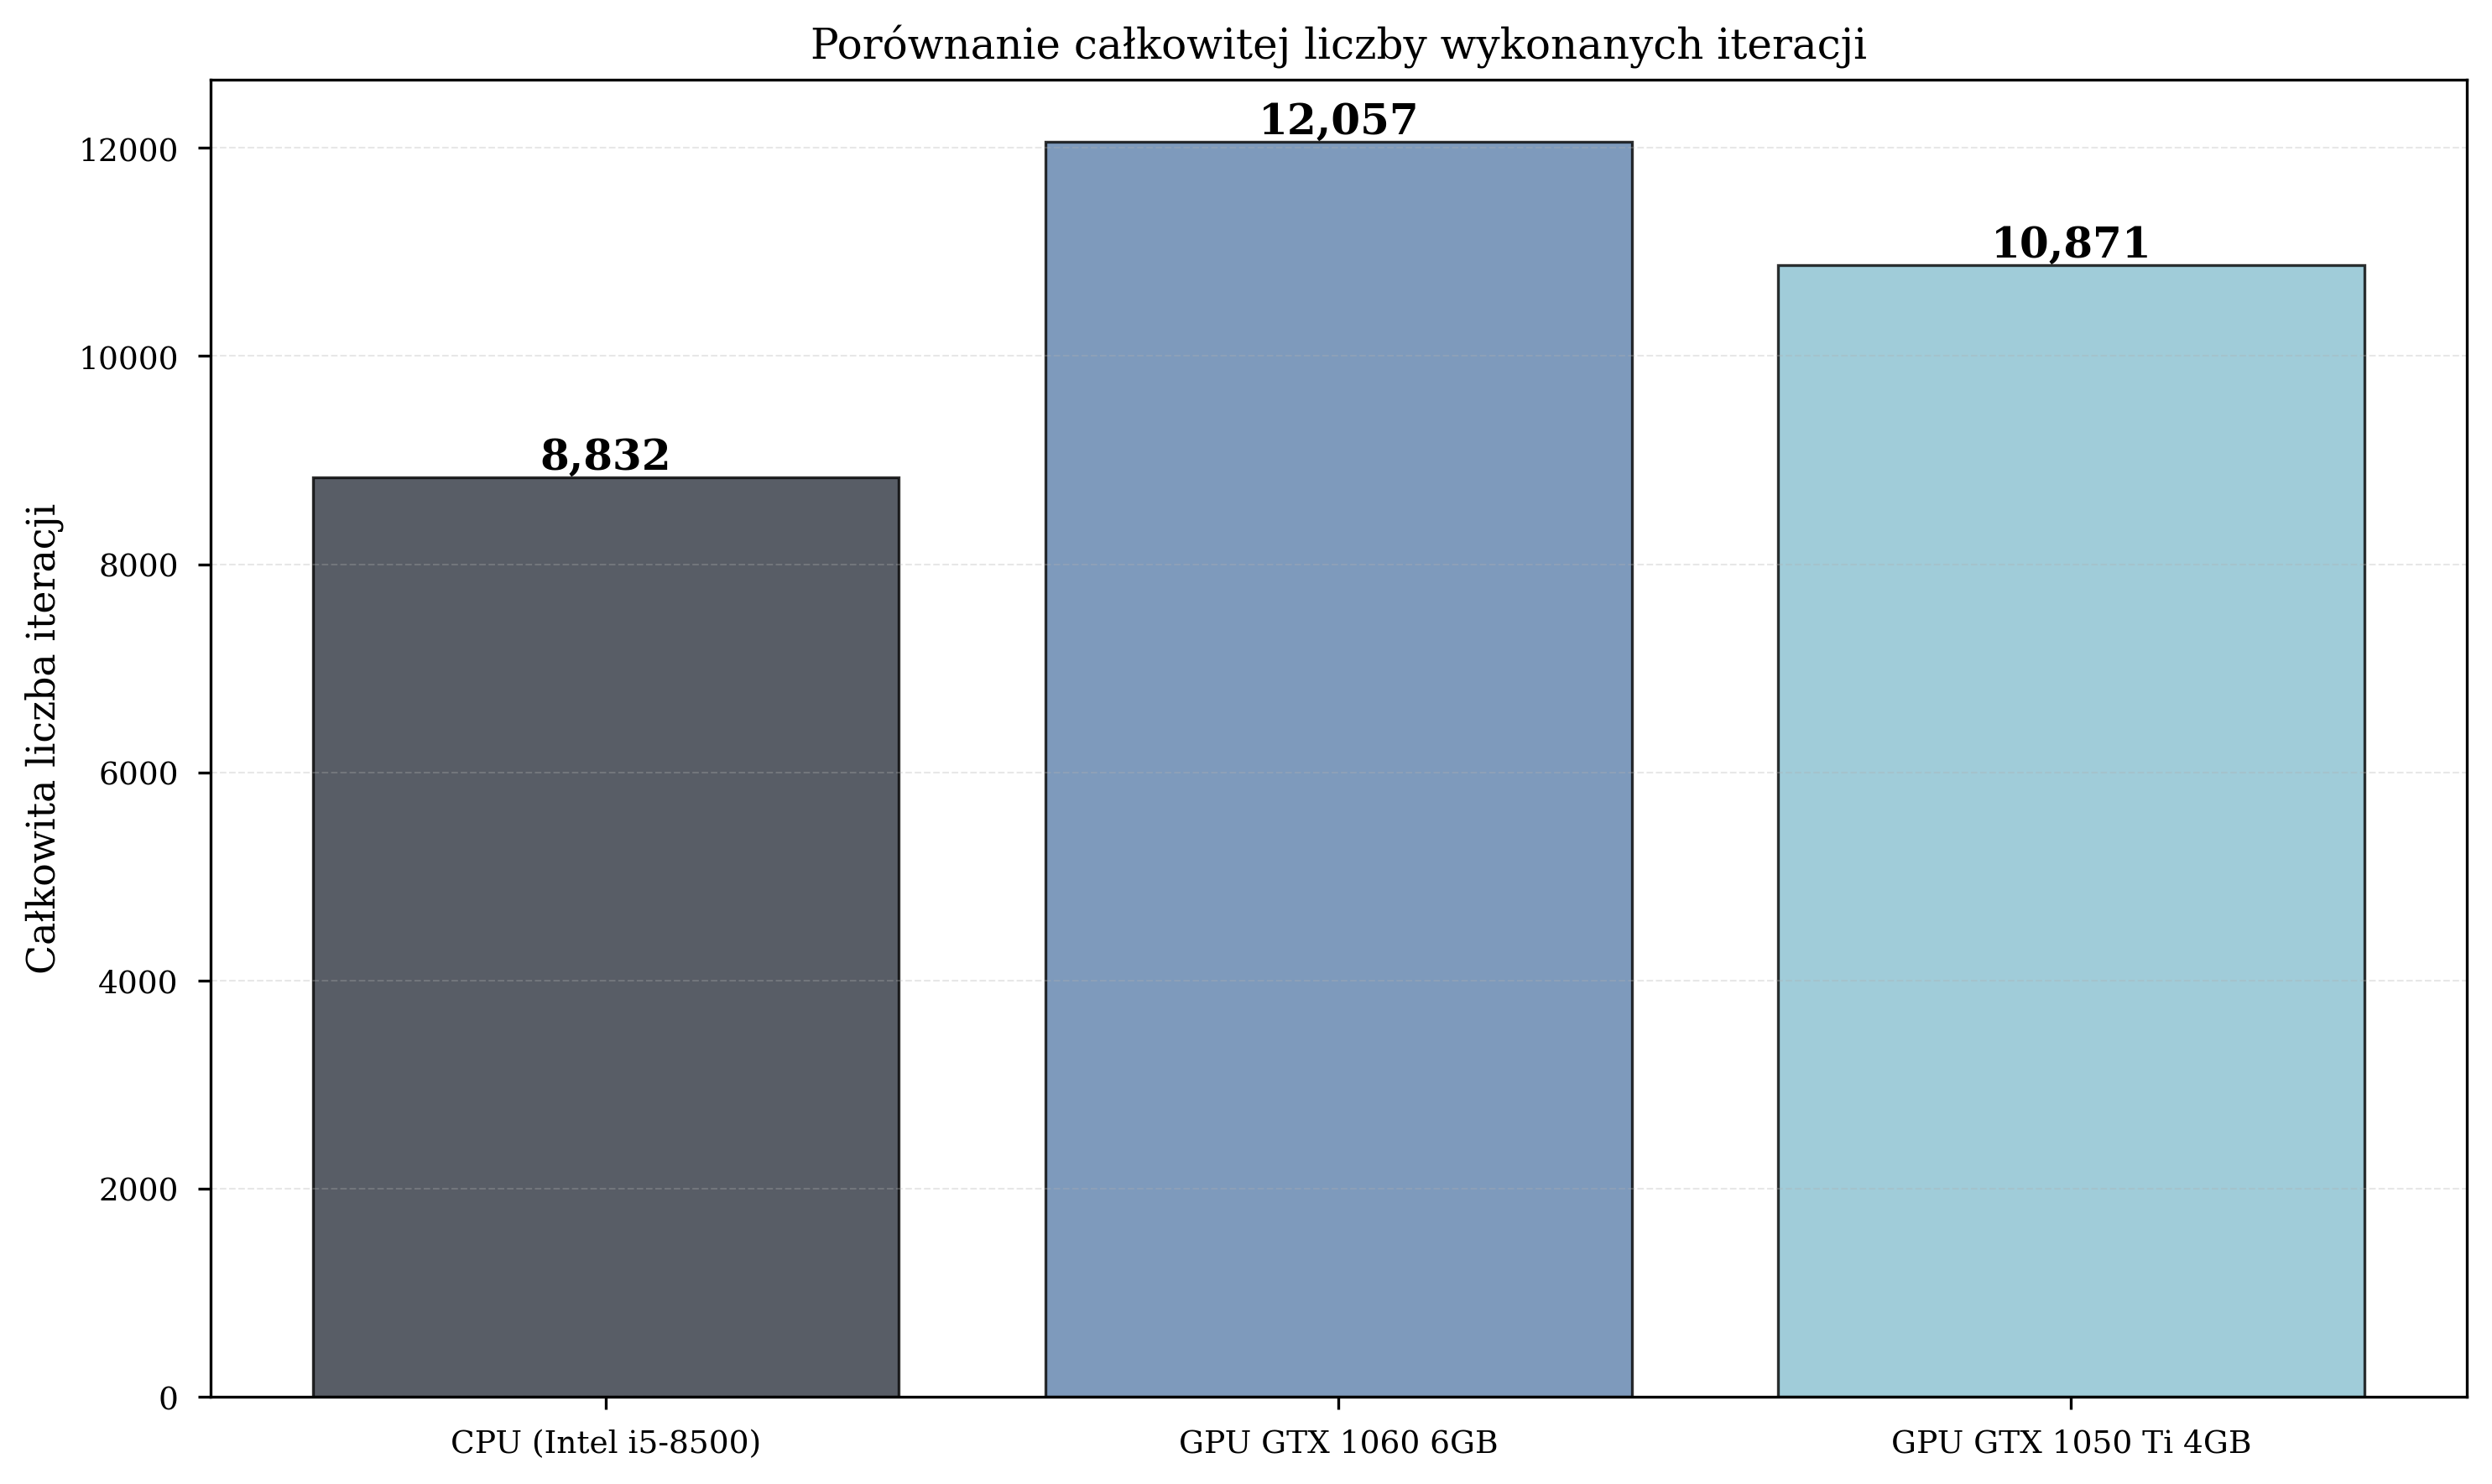
Overall Speedup
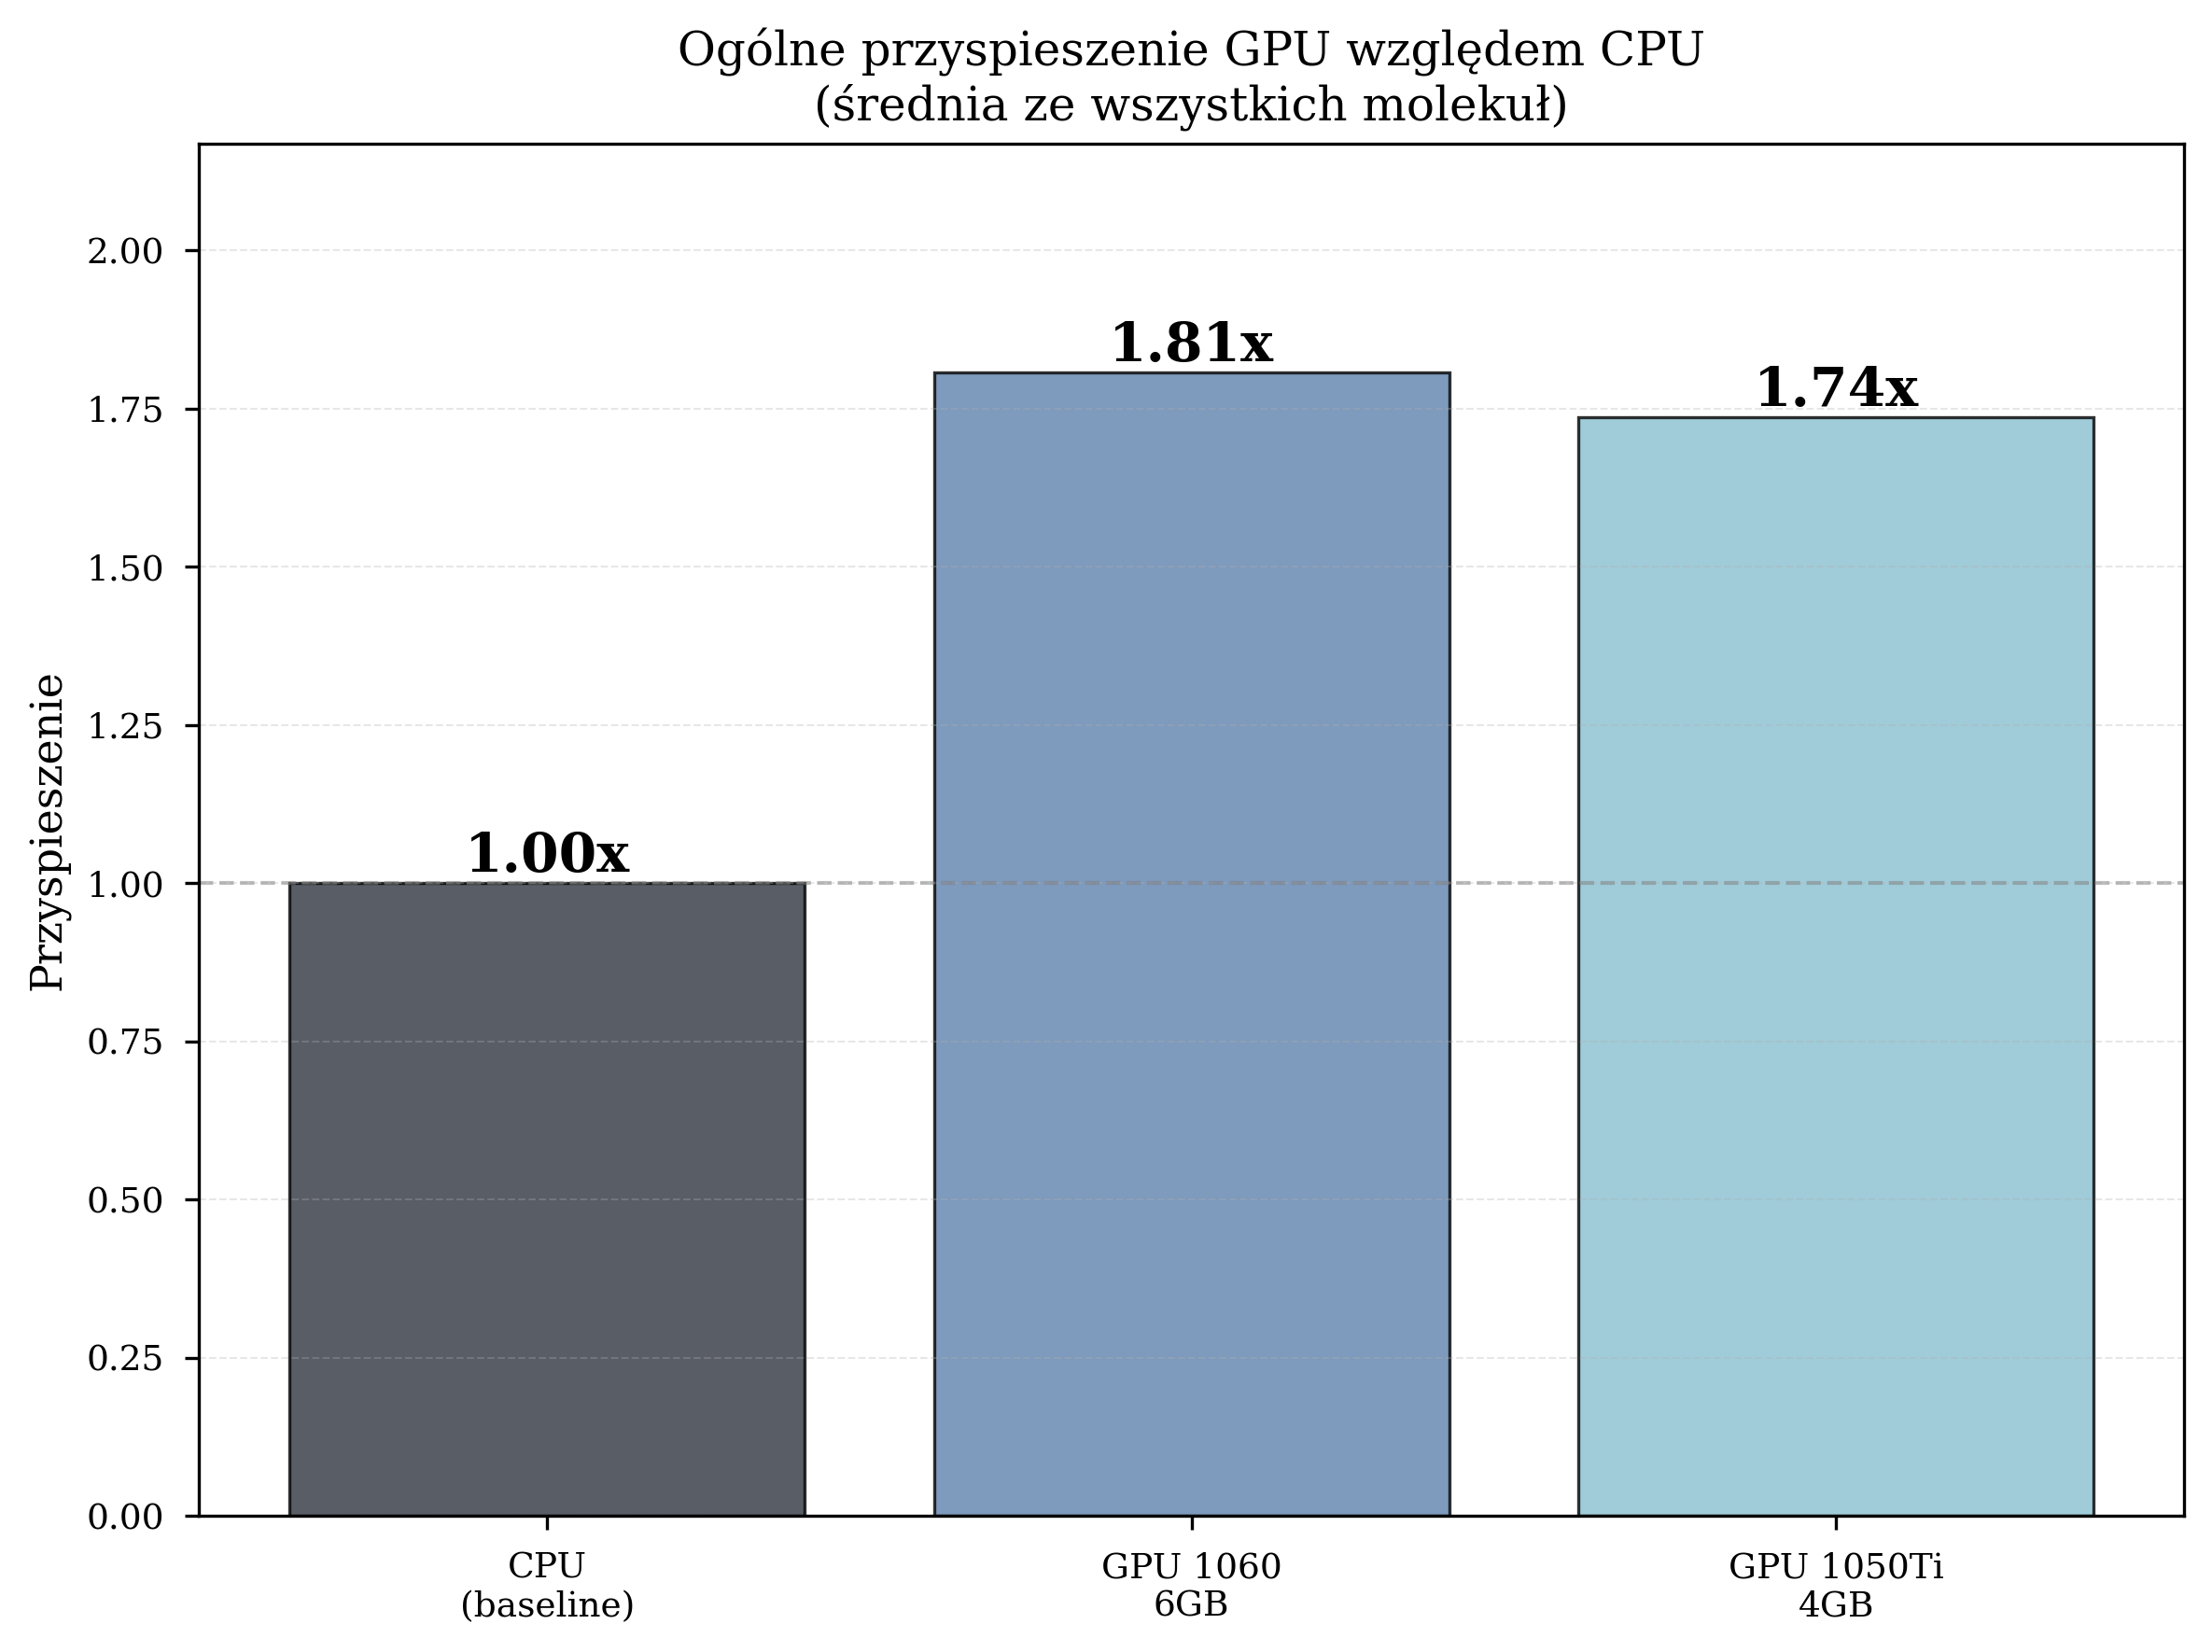
Aggregate performance statistics across all thesis experimental runs:
| Configuration | Avg. Time/Iteration (s) | Total Iterations | Speedup |
|---|---|---|---|
| CPU (Intel i5-8500) | 4.259 | 8,832 | 1.00x (baseline) |
| GPU GTX 1060 6GB | 2.357 | 12,057 | 1.81x |
| GPU GTX 1050 Ti 4GB | 2.454 | 10,871 | 1.74x |
The GPU GTX 1060, with its higher CUDA core count (1280 vs. 768) and greater VRAM capacity (6 GB vs. 4 GB), consistently outperforms the GTX 1050 Ti. However, both GPUs deliver meaningful acceleration over the CPU baseline.
The GPU configurations also completed a greater total number of iterations: GPU1 executed 36% more iterations than CPU (12,057 vs. 8,832), enabling more thorough exploration of the parameter space.
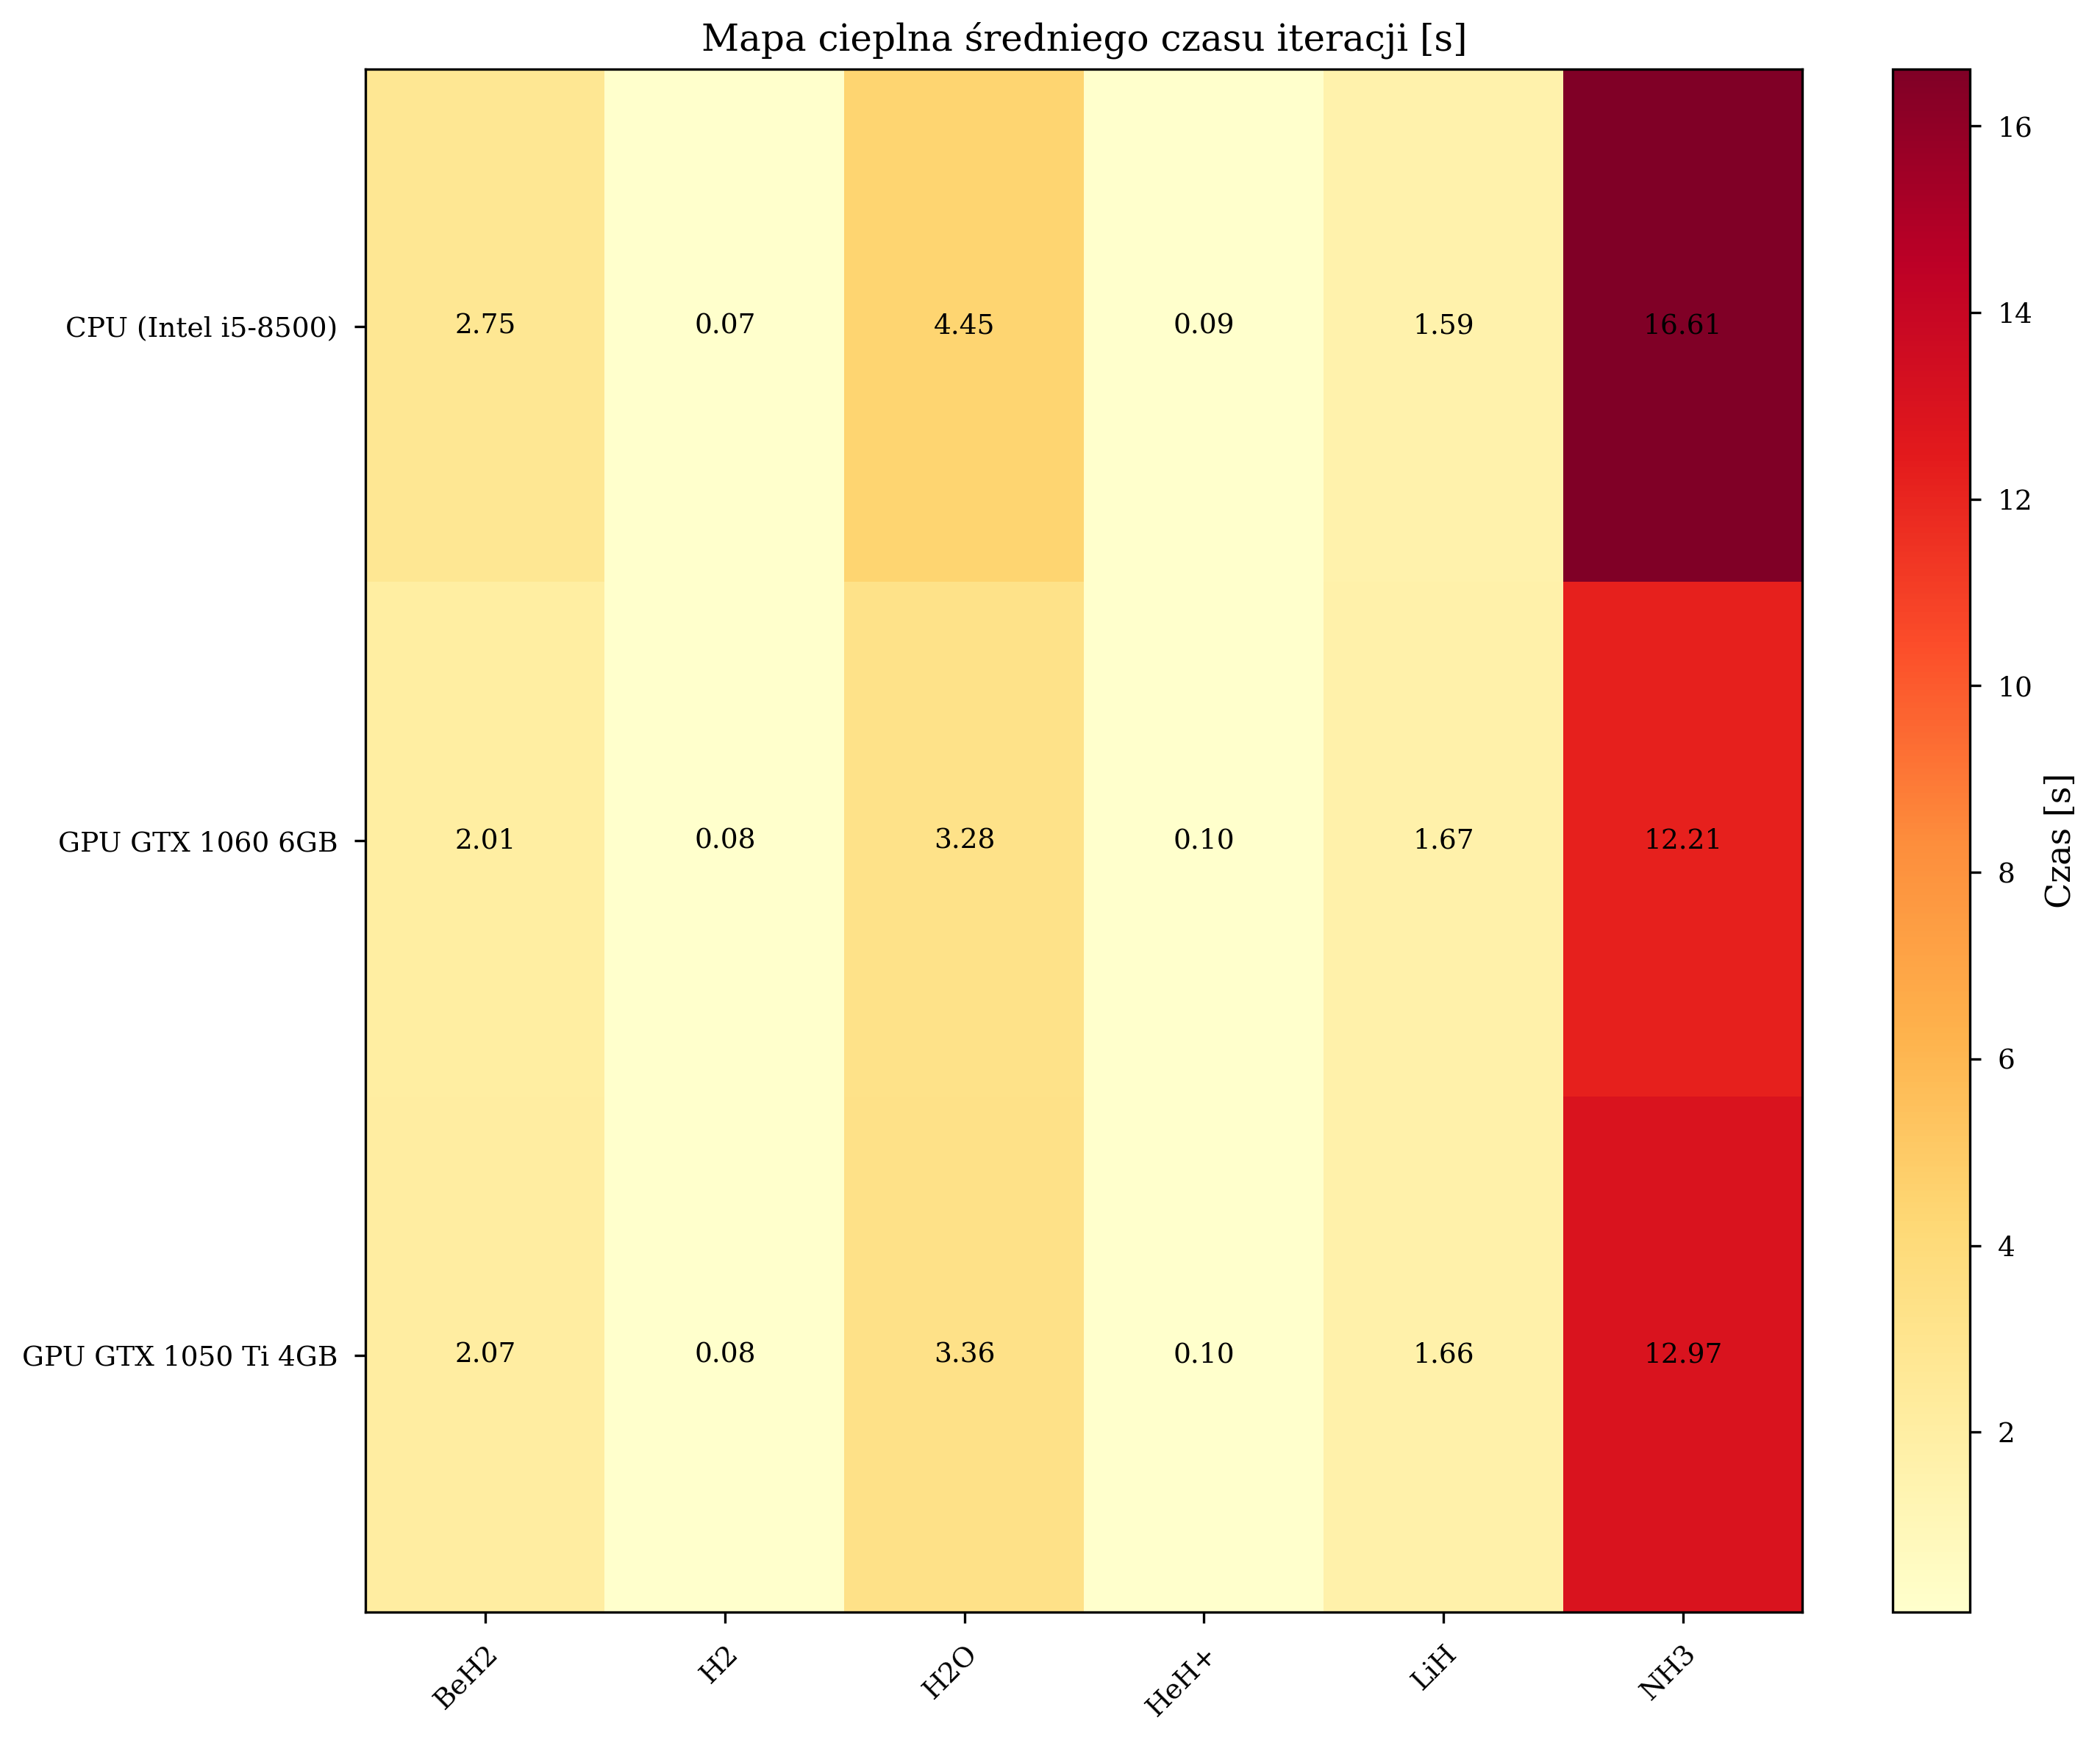
Iteration Time Analysis
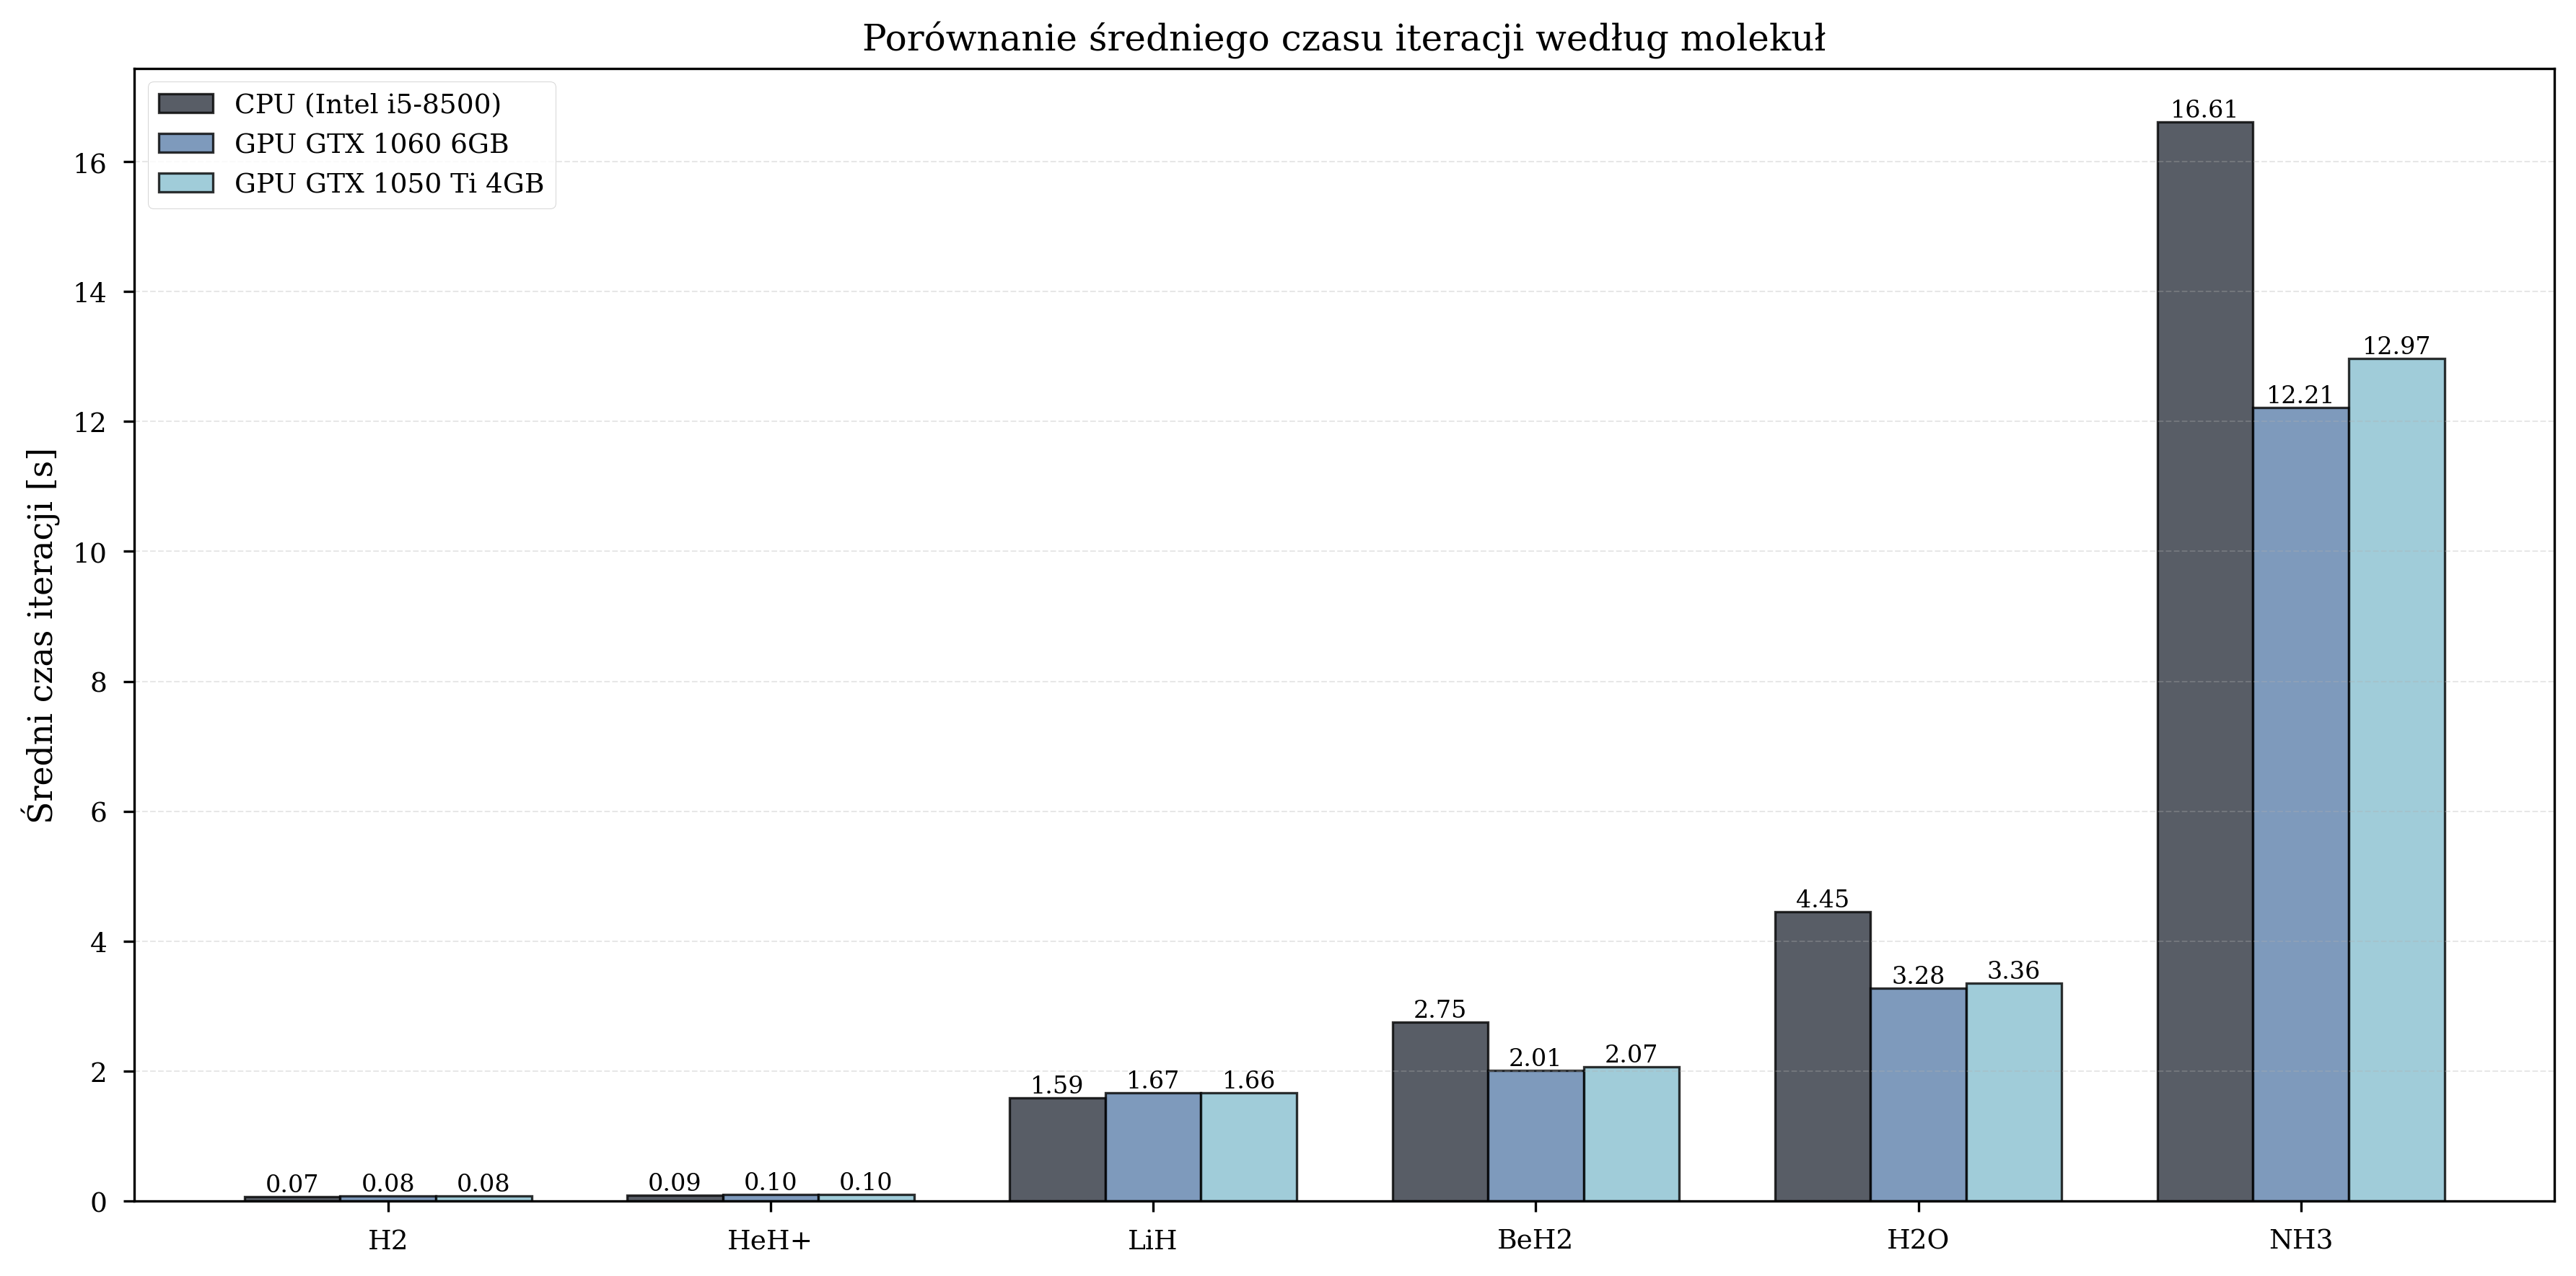
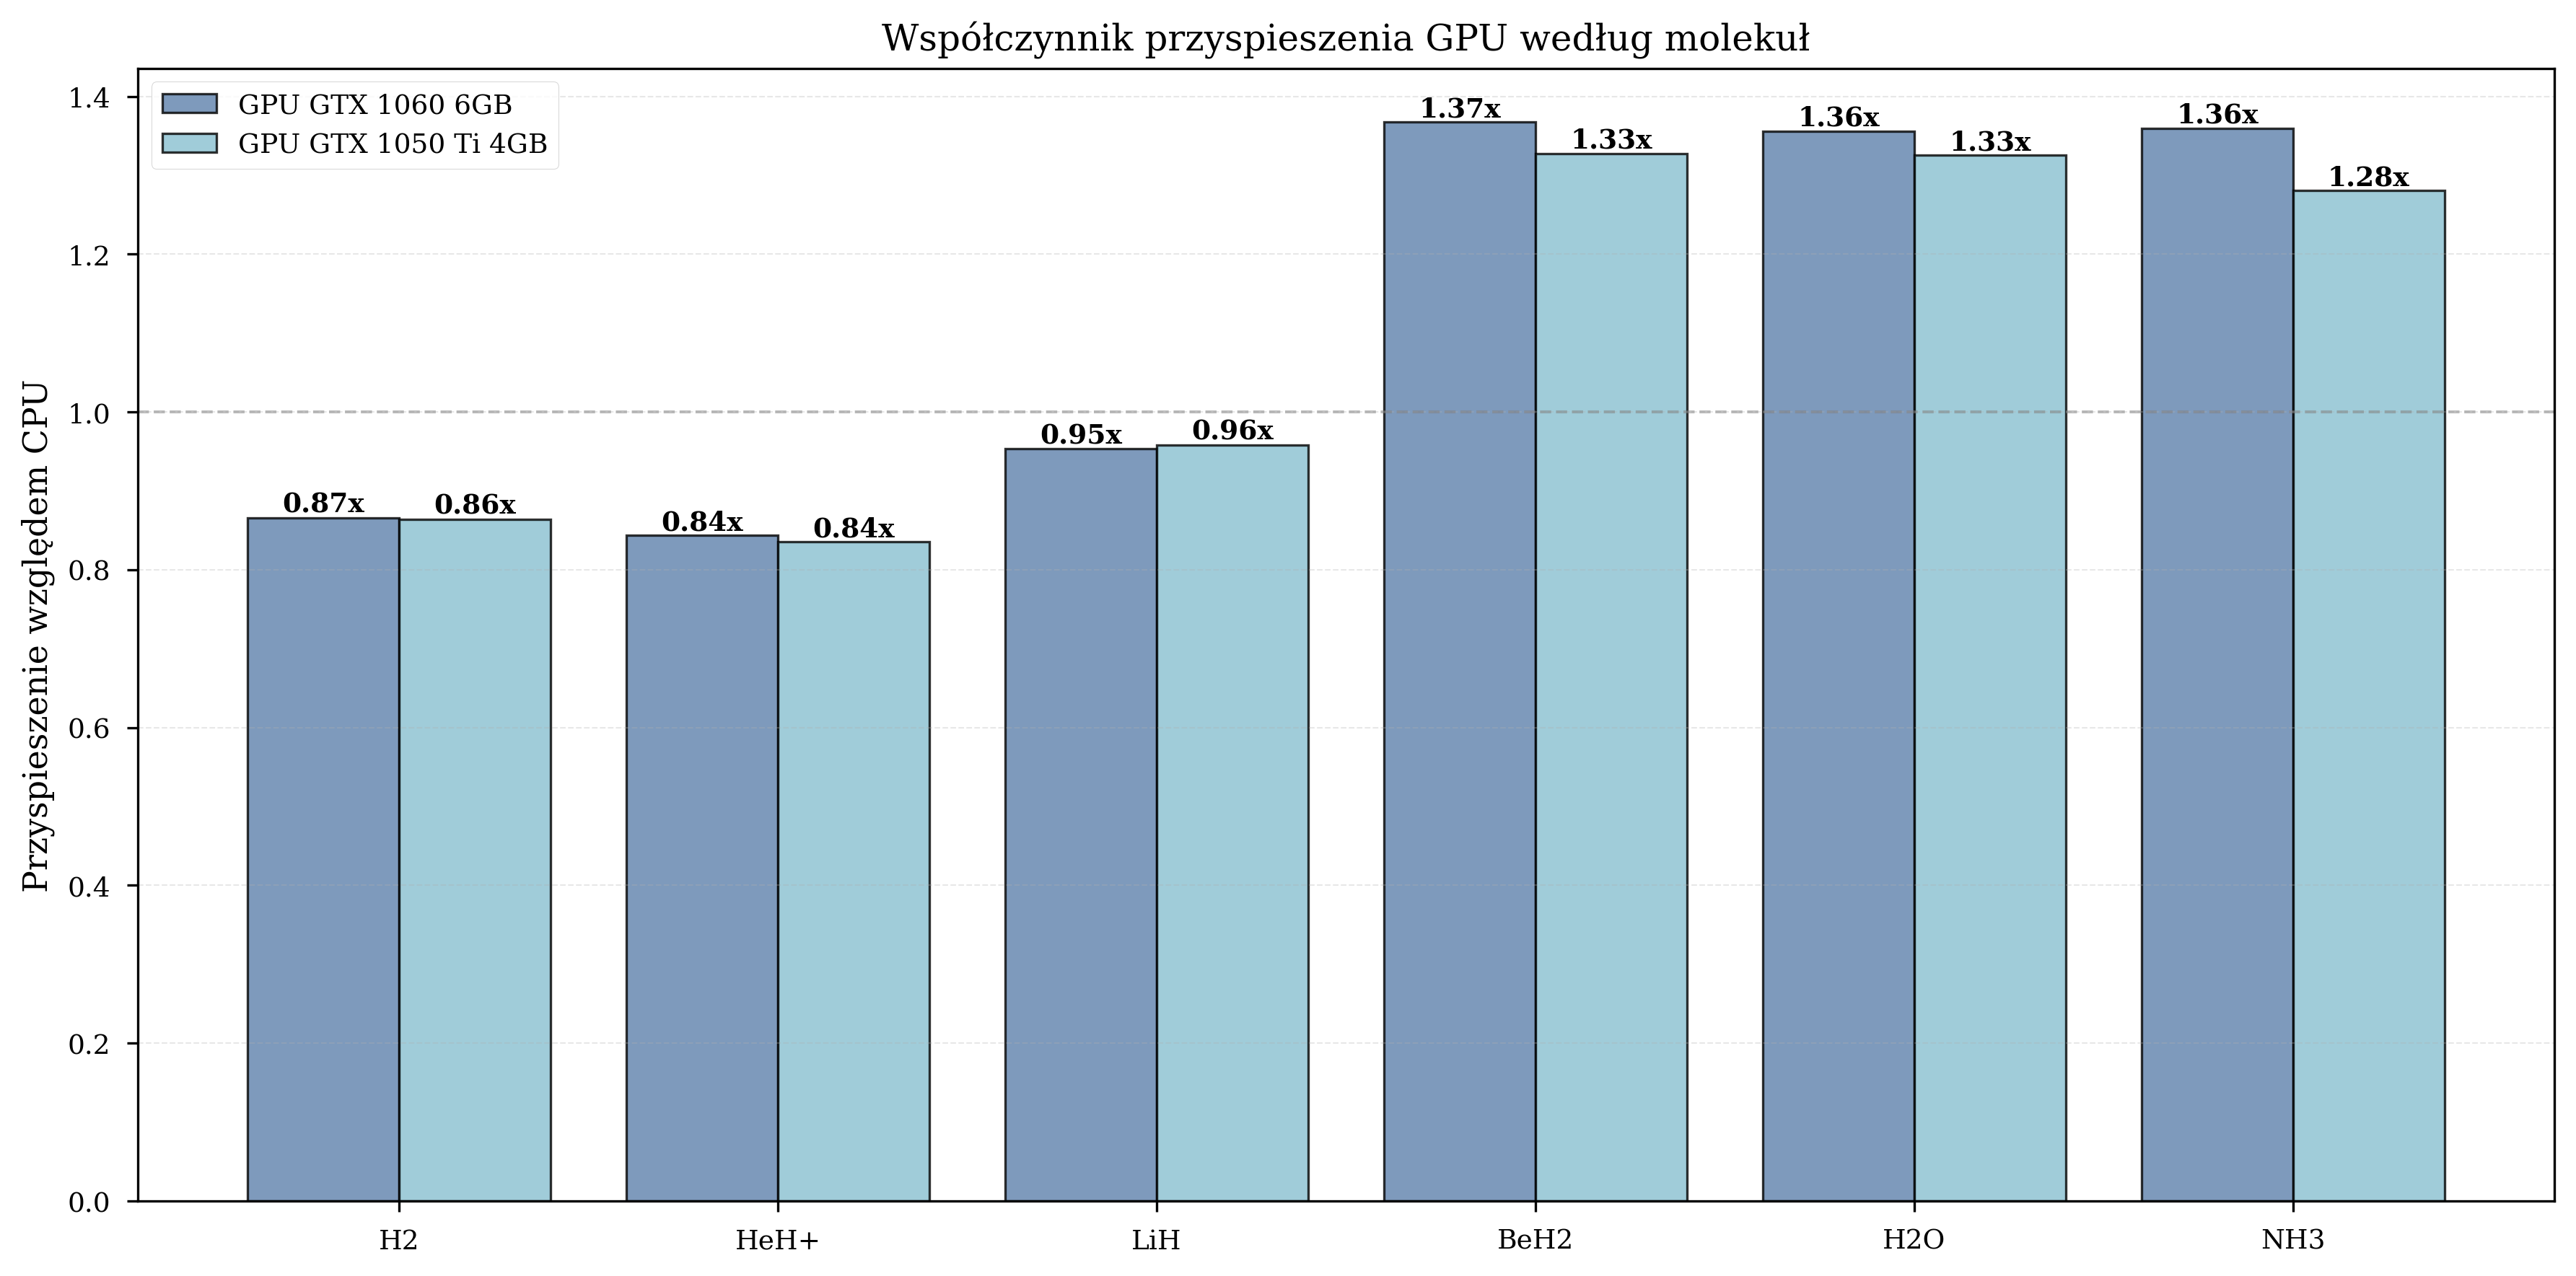
Scaling with Molecular Complexity
Measured GPU speedup by molecule:
| Molecule | Qubits | Avg. Iterations | GPU Speedup Range |
|---|---|---|---|
| H\(_2\) | 4 | 650 | 0.8-1.0x (GPU overhead dominates) |
| HeH\(^+\) | 4 | 630 | 0.9-1.1x (marginal benefit) |
| LiH | 12 | 1,455 | 1.5-1.6x (moderate) |
| BeH\(_2\) | 14 | 2,373 | 1.8-2.1x (significant) |
| H\(_2\)O | 14 | 2,185 | 1.3-1.4x (moderate) |
| NH\(_3\) | 16 | 2,410 | 1.3-1.4x (moderate) |
For small molecules, the overhead of data transfer between CPU and GPU memory negates the computational advantage. The crossover appears around LiH (12 qubits), beyond which GPU acceleration provides consistent benefits.
Iteration Count Comparison
Time vs. Iterations
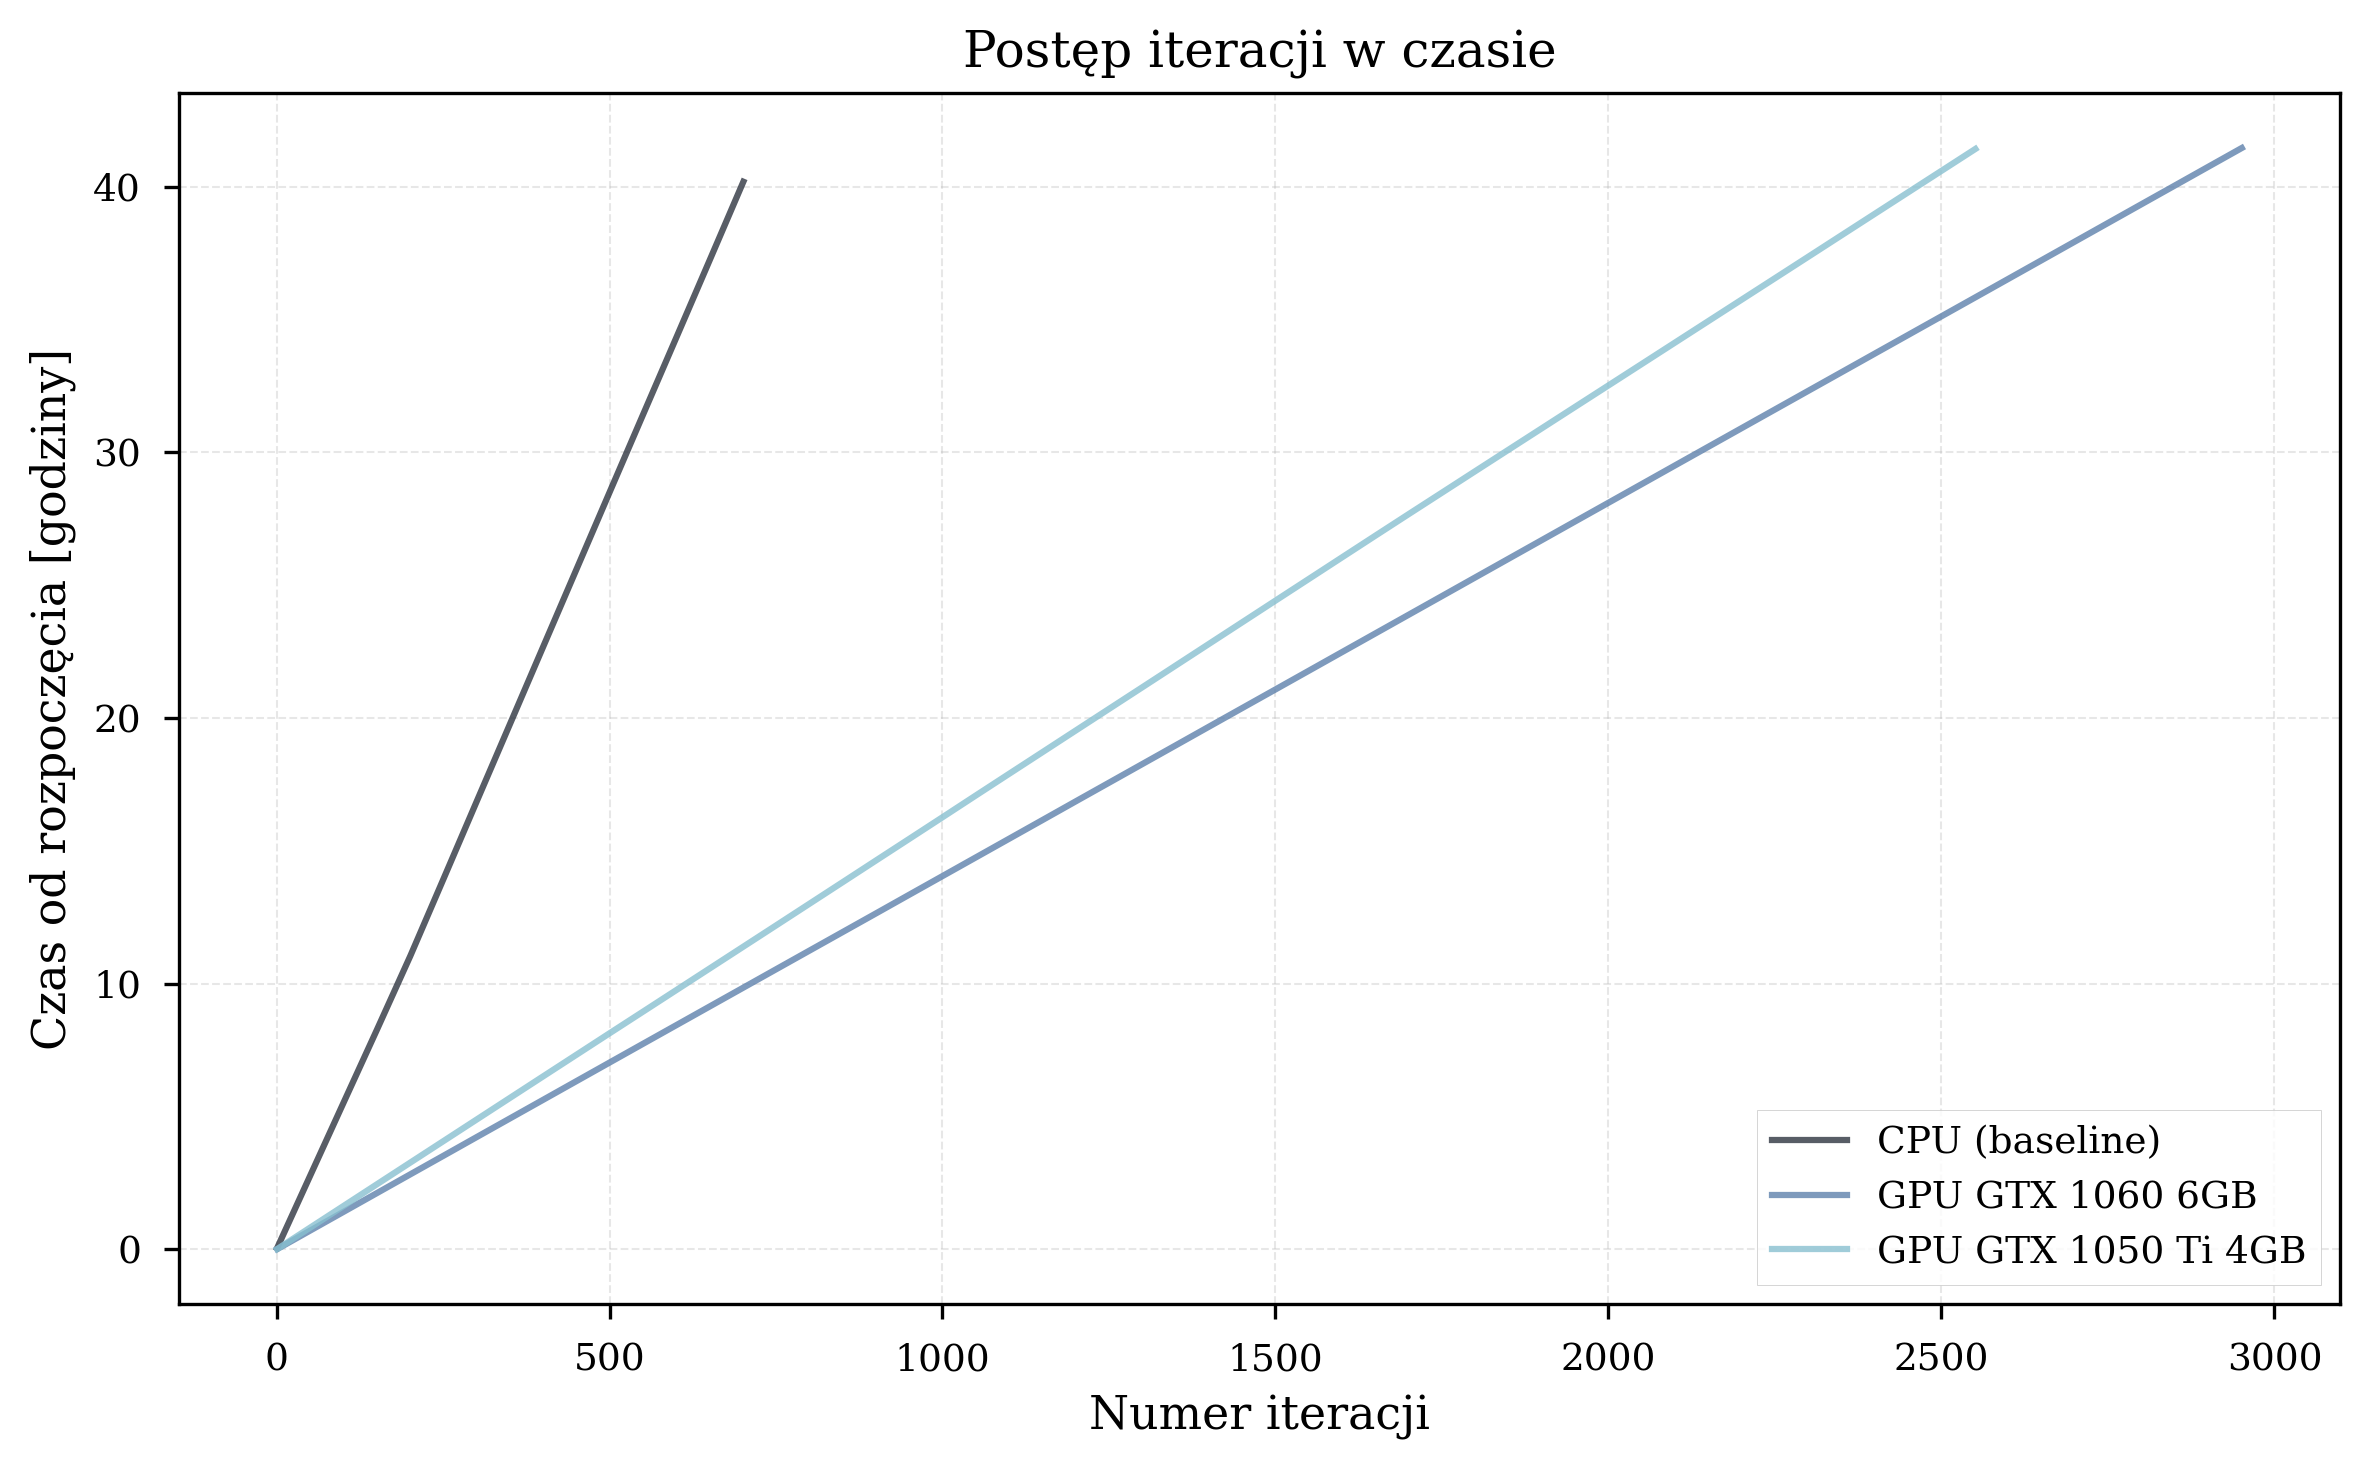
Speedup Summary
Practical Implications
In practical terms, a VQE simulation campaign requiring 7 days of CPU computation can be completed in approximately 4 days on a GTX 1060 GPU. For workflows involving many molecular configurations, this compounds.
Basis Set Impact
STO-3G Performance (Primary Experiments)
All primary thesis benchmarking experiments utilized the STO-3G basis set, which provides a computationally efficient baseline with 4-16 qubits for the tested molecular systems. The results presented in the preceding sections - speedup factors of 1.74-1.81x, convergence within hundreds to thousands of iterations - are representative of STO-3G performance.
CC-pVDZ Performance (Extended Experiments)
Additional thesis experiments were conducted with the cc-pVDZ basis set on H\(_2\) only (due to computational constraints).
| Configuration | STO-3G Time/Iter (s) | cc-pVDZ Time/Iter (s) | Slowdown |
|---|---|---|---|
| CPU (i5-8500) | ~4.3 | 206.19 | ~48x |
| GPU GTX 1060 | ~2.4 | 50.55 | ~21x |
| GPU GTX 1050 Ti | ~2.5 | 58.42 | ~23x |
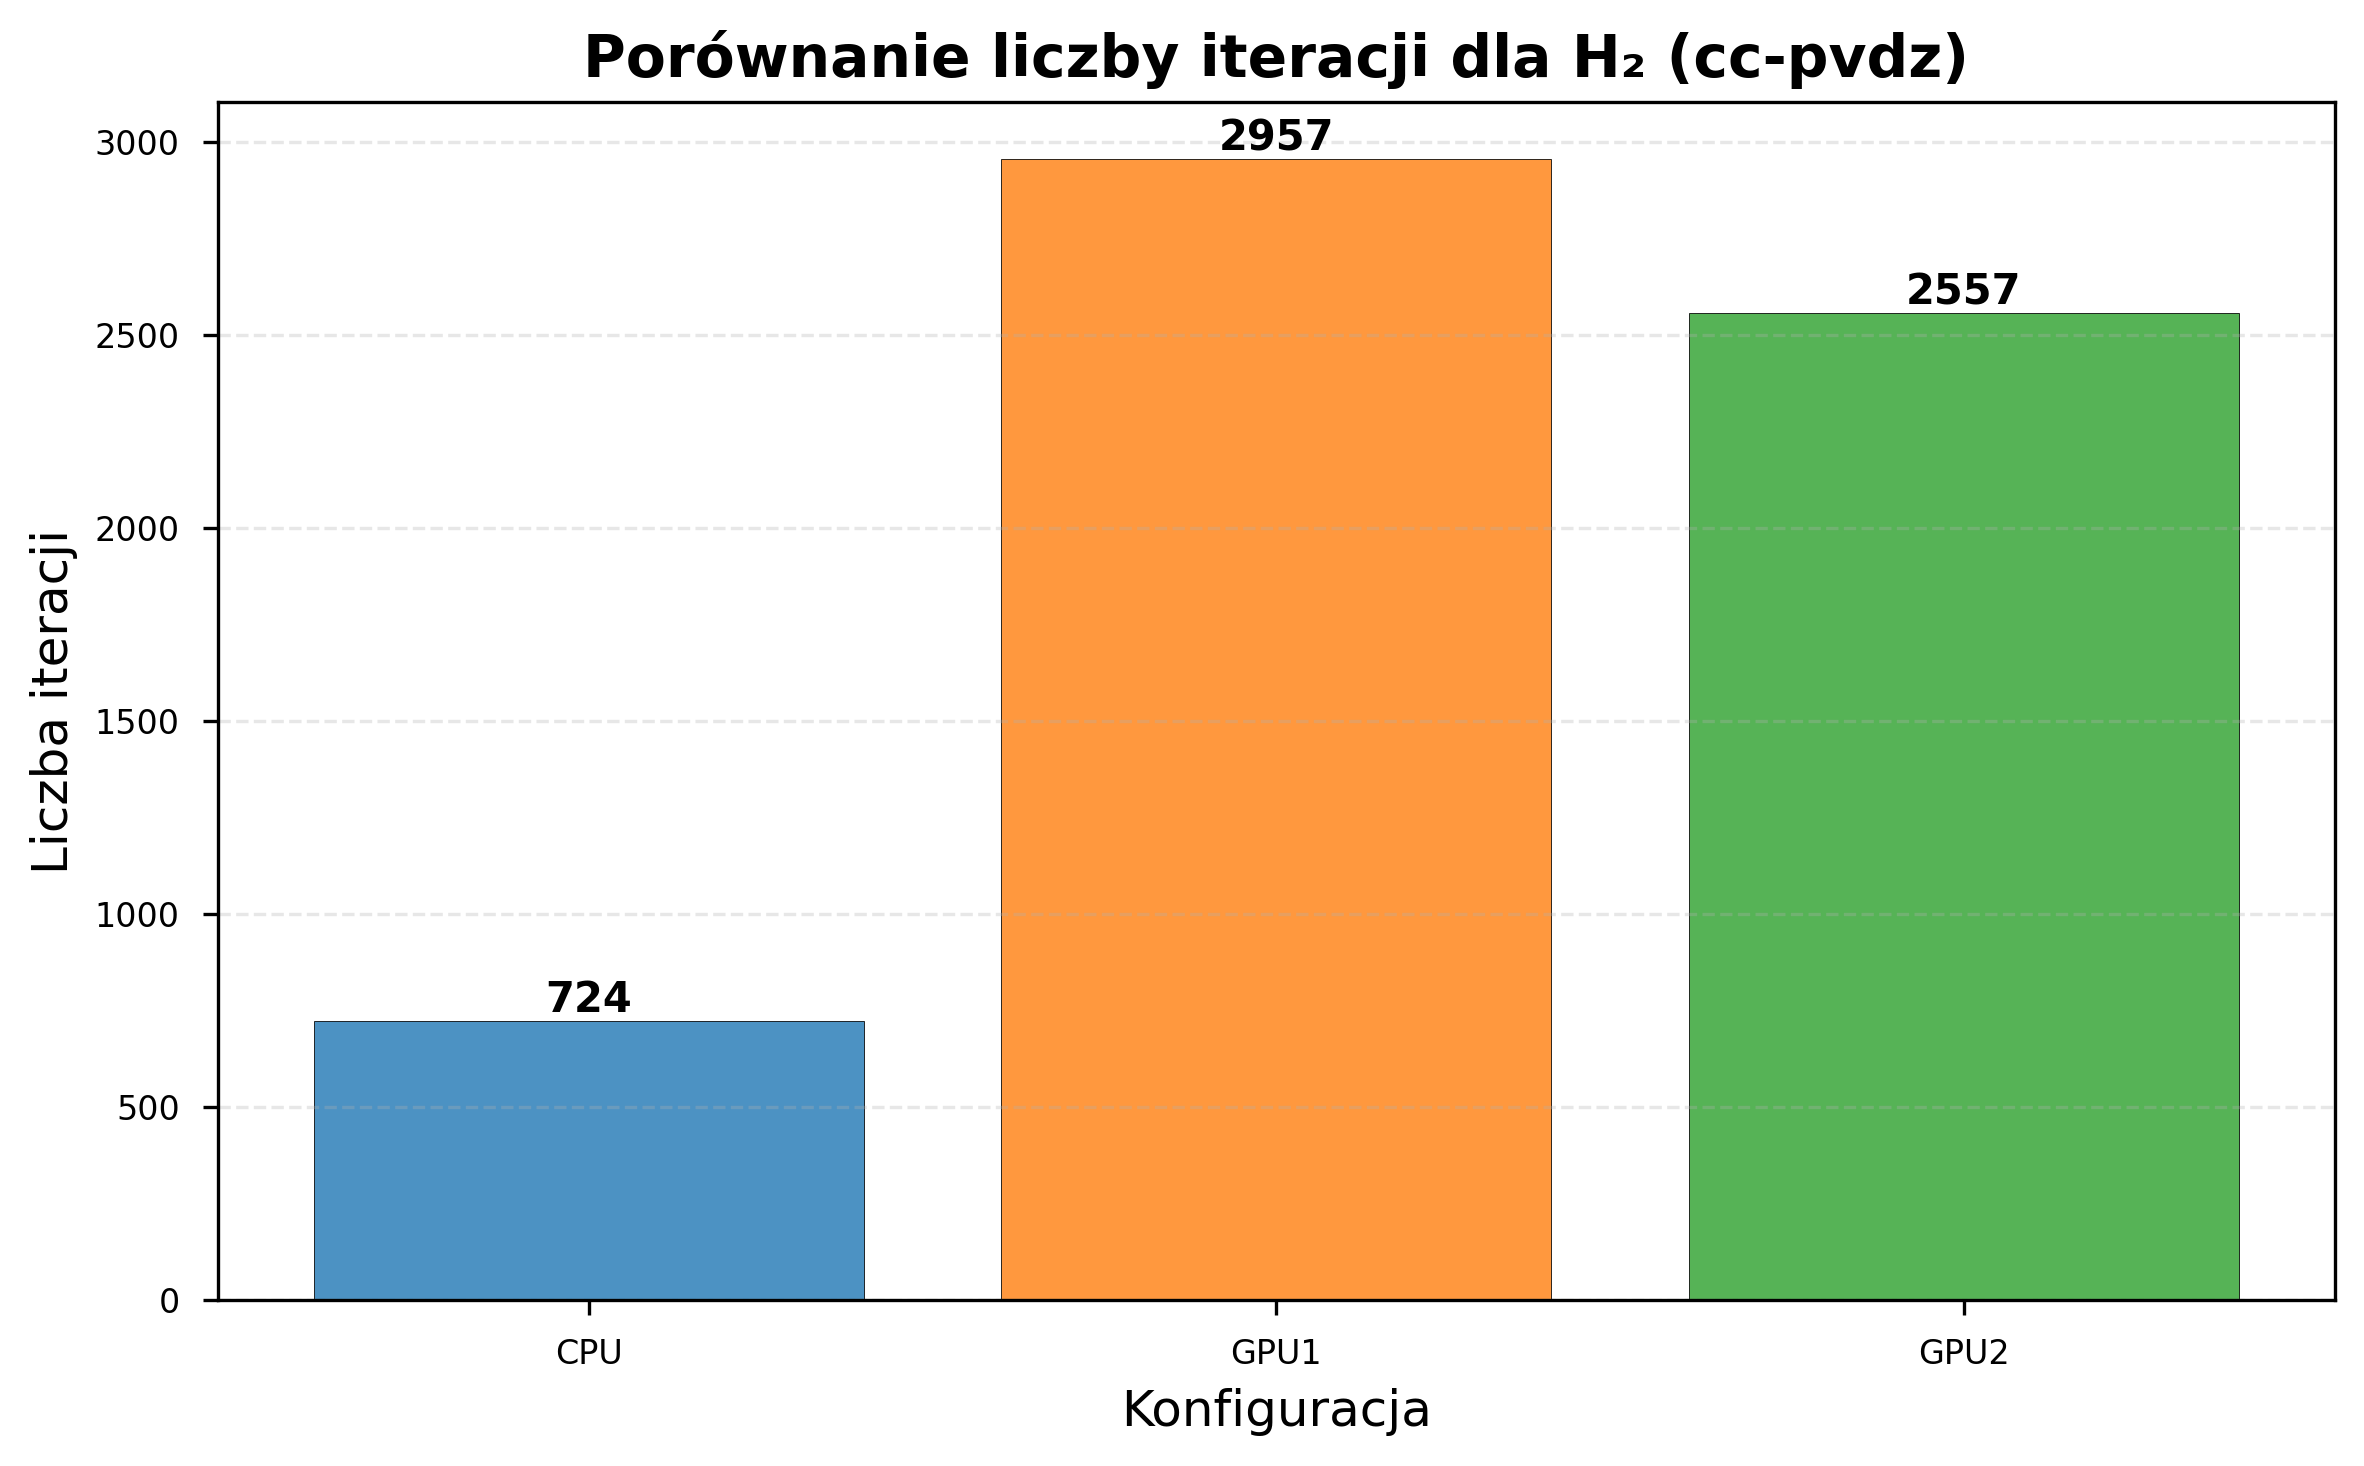
GPU acceleration scaled favorably with basis set complexity:
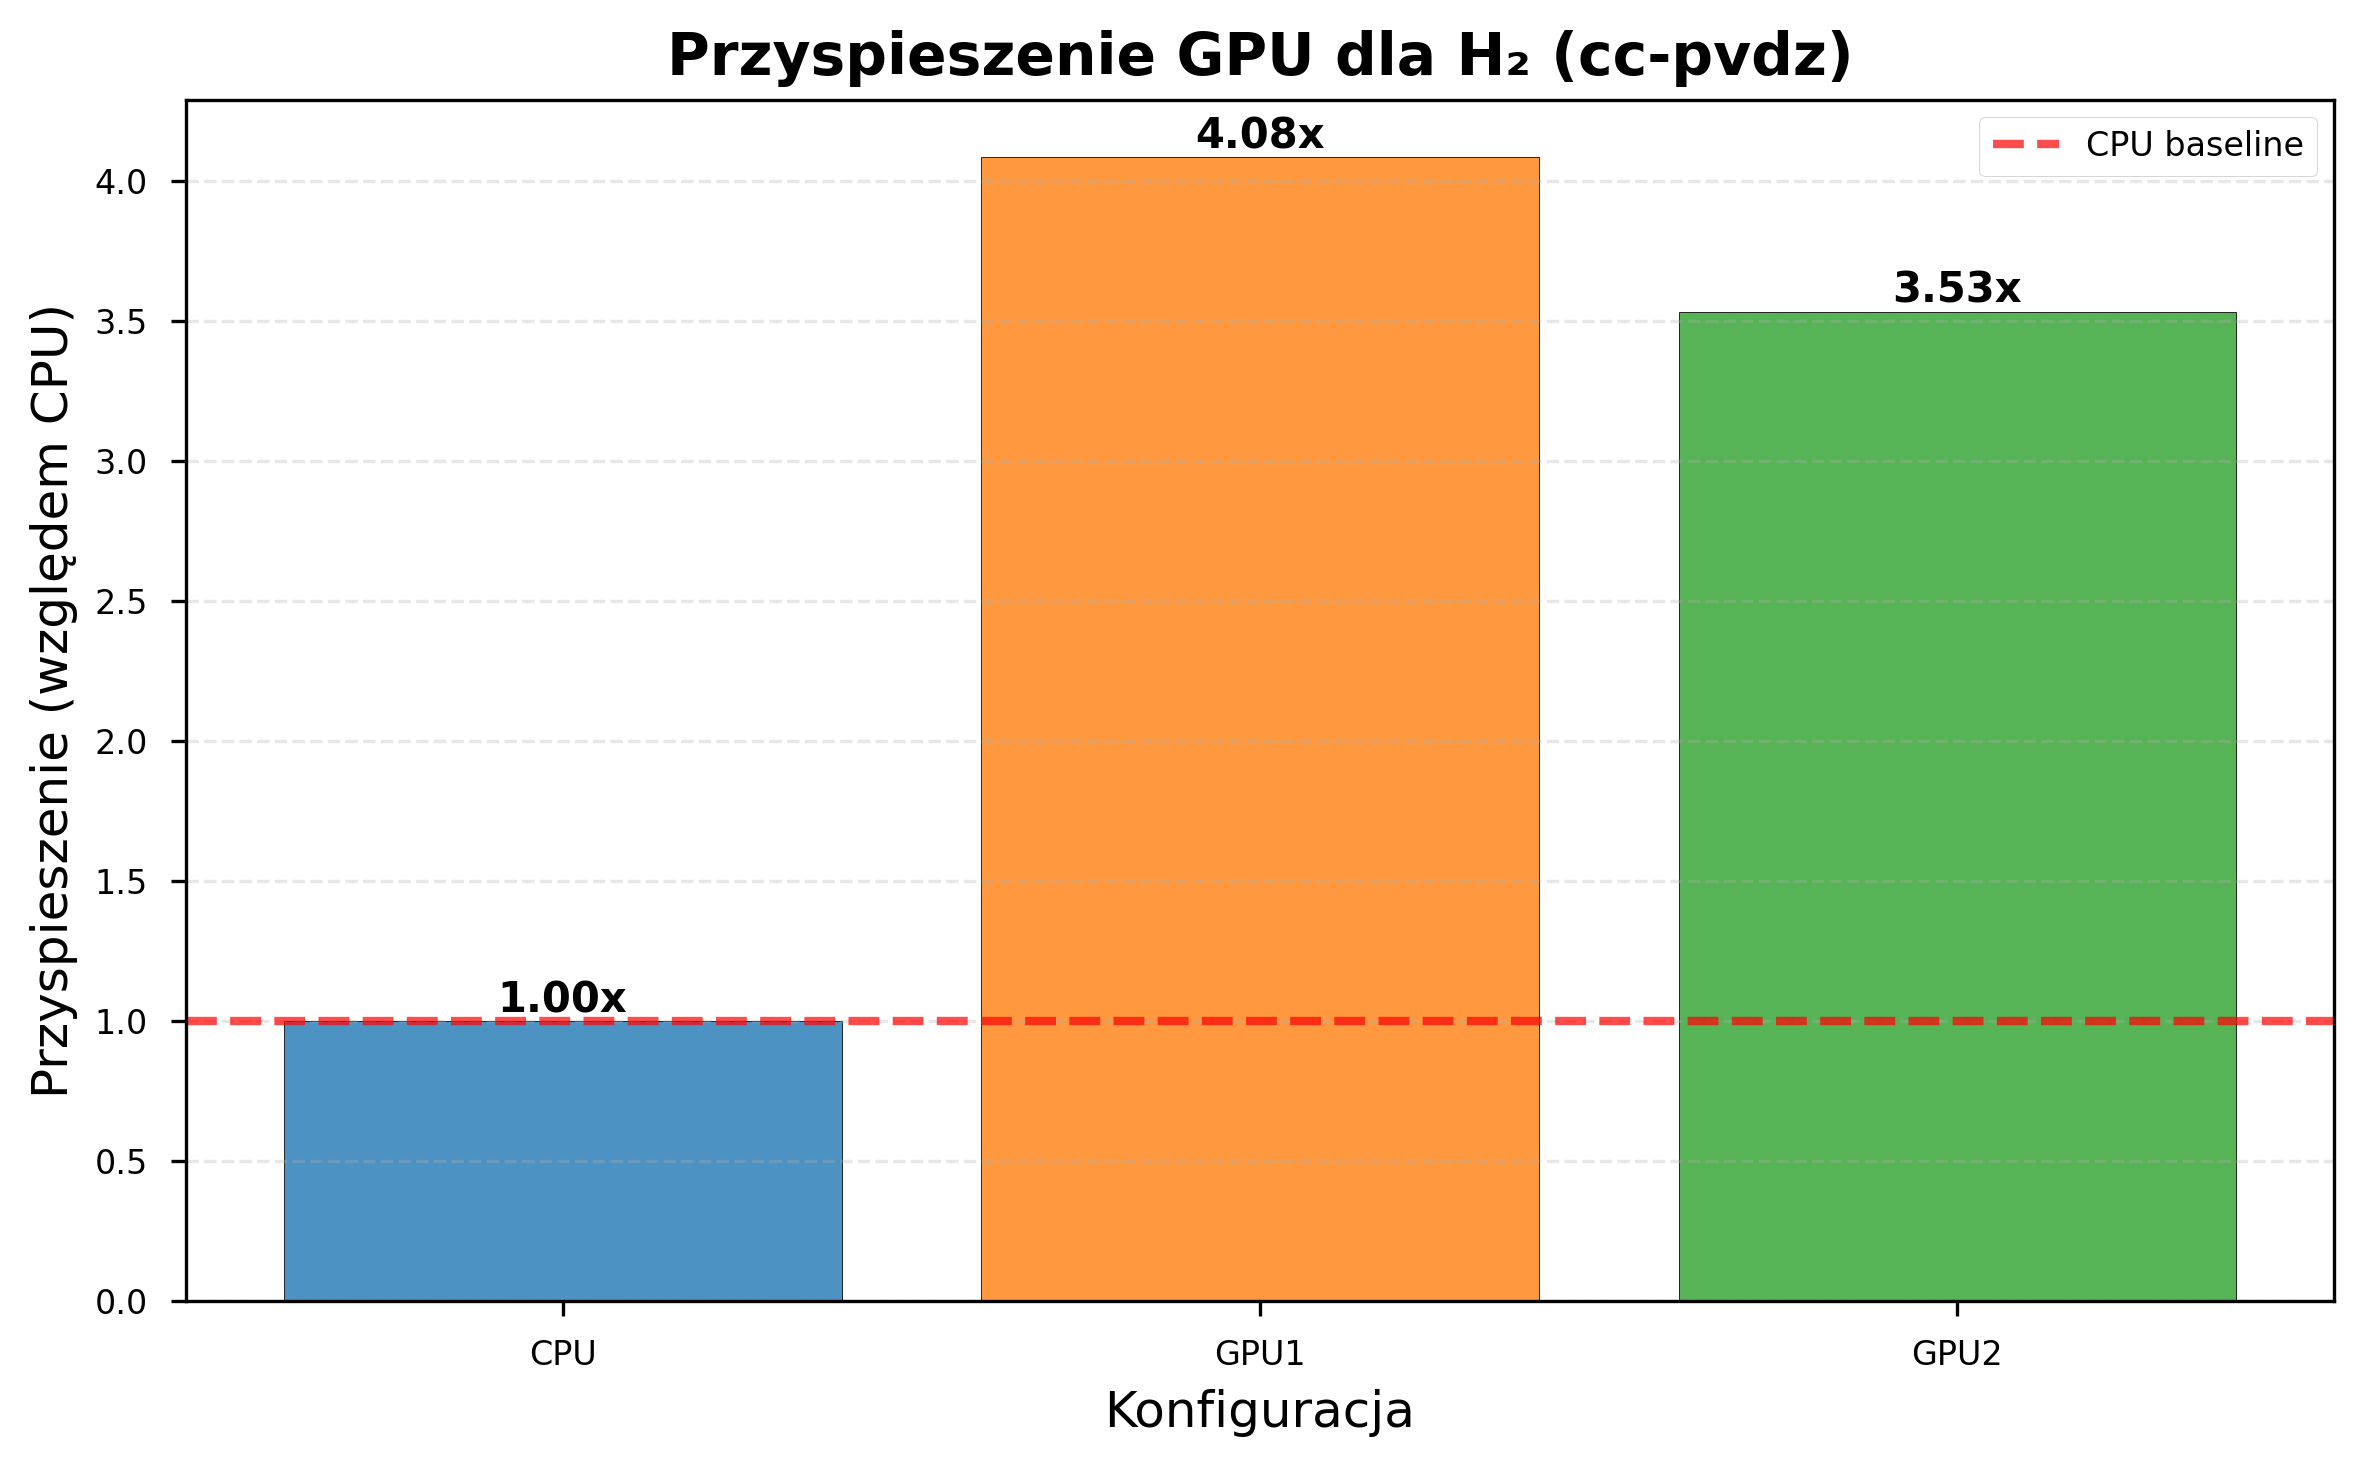
| Metric | STO-3G | cc-pVDZ |
|---|---|---|
| GPU1 speedup | 1.81x | 4.08x |
| GPU2 speedup | 1.74x | 3.53x |
| CPU iterations (same time) | 8,832 | 724 |
| GPU1 iterations (same time) | 12,057 | 2,957 |
| GPU2 iterations (same time) | 10,871 | 2,557 |
CC-pVDZ: Optimization Failure
Despite the significant speedup, the cc-pVDZ thesis experiments revealed convergence difficulties inherent to larger basis sets under random initialization:
- None of the configurations converged to the correct ground-state energy for H\(_2\).
- Random parameter initialization proved inadequate for the expanded parameter space.
- HF initialization was not tested with cc-pVDZ in the thesis, but the v2.0.0 6-31G results suggest it could help significantly.
Practical Notes on Basis Set Selection
Based on the combined thesis and v2.0.0 experiments:
- STO-3G was the only basis set tested across all six molecules. Iteration times of 2-4 seconds make it suitable for development and prototyping.
- 6-31G was tested on H\(_2\) and HeH\(^+\) in v2.0.0. Random init failed; HF init
produced good results. Use
--init-strategy hfwith this basis set. - cc-pVDZ was tested only on H\(_2\) in the thesis (random init). CPU iteration times of ~206 seconds make GPU acceleration a practical necessity.
- Initialization is the single most important factor for convergence quality, especially with larger basis sets.
Detailed Error Analysis
Sources of Discrepancy
The relative errors between VQE results and literature values arise from several sources:
- Random parameter initialization: For larger molecules, the optimizer may converge to a local minimum far from the global optimum. This is the dominant error source in the thesis experiments.
- Ansatz expressibility: The EfficientSU2 ansatz does not encode domain-specific molecular structure knowledge. Chemistry-inspired ansatze such as UCCSD were not tested but could potentially perform better at the cost of greater circuit depth.
- Barren plateaus: For higher qubit counts, gradient magnitudes can vanish exponentially, impeding gradient-based optimizers like L-BFGS-B (McClean et al. 2018). The v2.0.0 6-31G results are consistent with this (L-BFGS-B with random init produced a positive energy for H\(_2\)), though diagnosing a barren plateau would require showing gradient variance vanishing with system size.
- Basis set truncation: STO-3G is a minimal basis set, though both VQE and reference values use the same basis, so optimization quality is the primary source of discrepancy.
What the Experiments Showed
What worked:
- GPU acceleration: 1.74-1.81x speedup for STO-3G, 3.53-4.08x for cc-pVDZ, with no degradation of numerical accuracy.
- Scaling: GPU benefit increases with qubit count and basis set size.
- More iterations completed: GPU configurations completed up to 36% more iterations in the same time budget.
- HF initialization (v2.0.0): Consistently reaches lower energies than random init, especially with larger basis sets. Reduces sensitivity to optimizer choice.
What did not work:
- Energy accuracy with random init: 4-25% errors relative to reference values across all molecules in the thesis.
- Random initialization at scale: Inadequate for larger systems and advanced basis sets - the primary driver of poor energy results.
Limitations and Future Work
Current Limitations
The benchmarking results presented here are subject to several limitations that should be considered when interpreting the findings:
-
Limited HF init testing. HF initialization has been tested only on H\(_2\) and HeH\(^+\) (STO-3G and 6-31G). Its effectiveness on larger molecules and cc-pVDZ remains unverified. The pre-optimization fidelity degrades with system size (1.0 for H\(_2\) vs. 0.993 for H\(_2\)O), which may limit its benefit for larger systems.
-
HF init restricted to EfficientSU2. The Hartree-Fock pre-optimization is only implemented for EfficientSU2. RealAmplitudes and ExcitationPreserving fall back to random initialization.
-
Limited cc-pVDZ data. The cc-pVDZ experiments were conducted only for H\(_2\) due to computational constraints. Extending these experiments to larger molecules would provide more comprehensive basis set scaling data.
-
Simulator-only results. All experiments were conducted using statevector simulation. Results on real quantum hardware would be subject to additional factors including gate noise, measurement error, and decoherence.
-
No systematic multi-optimizer benchmarking. The v2.0.0 verification tested six optimizers on H\(_2\) and HeH\(^+\) only. A systematic study across all supported optimizers and all molecules has not been conducted.
Planned Extensions
The following extensions are informed by the thesis discussion (Chapter 6) and address the identified limitations directly.
Algorithmic improvements:
- Broader HF init validation - extending HF initialization testing to larger molecules and cc-pVDZ to understand where fidelity degradation becomes a practical limitation.
- HF init for other ansatze - extending the pre-optimization to support RealAmplitudes and ExcitationPreserving.
- Adaptive ansatze (ADAPT-VQE) - dynamically growing the circuit to reduce barren plateau effects and avoid unphysical states (Grimsley et al. 2019).
- Systematic multi-optimizer benchmarking - leveraging the existing supported optimizers to characterize optimizer-molecule-hardware interactions.
Hardware and platform modernization:
- Cloud quantum platform integration - extending backend support to Amazon Braket and Azure Quantum alongside the existing IBM Quantum integration, enabling real-device validation on NISQ hardware.
- Benchmarking cloud GPU instances - this would allow for not only faster results but also more credible information, up to date with current state of the technology. Planned once project is more reliable and tested.
Extended experimentation:
- Basis set studies - extending 6-31G and cc-pVDZ experiments to all molecules to establish comprehensive basis set scaling data.
- ML-based optimization - using the accumulated iteration data to train models for optimization trajectory prediction, automatic optimizer selection, and fast surrogate energy estimators.
Infrastructure:
- Scaling beyond single-node Docker Compose - exploring multi-node deployment options for improved resource management.
- Parallel multi-molecule processing - simultaneous processing of multiple molecular systems with automatic load balancing across available hardware.
Summary
The clear positive result: GPU acceleration delivers consistent speedups - 1.74-1.81x for STO-3G, 3.53-4.08x for cc-pVDZ - and scales favorably with problem complexity. GPU configurations complete up to 36% more iterations in the same time budget.
The initialization improvements: HF initialization avoids the barren plateaus and local minima that plagued random initialization. Still, this approach requires more testing and attention.